How it works
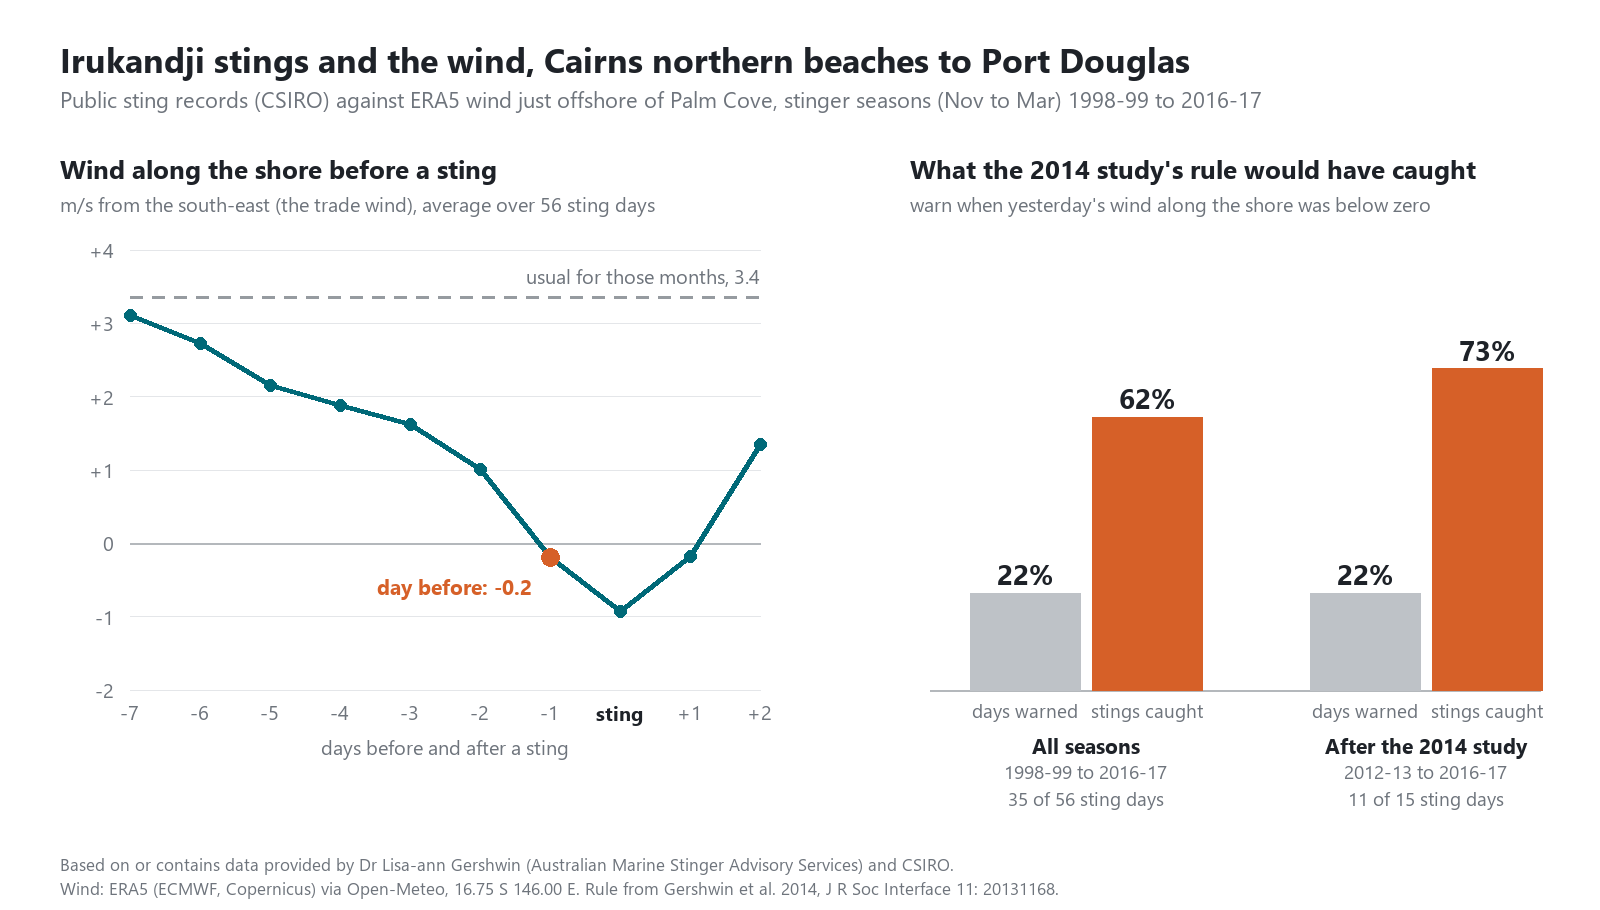
A CSIRO study in 2014 found that Irukandji stings on this coast tend to follow a drop in the south-east trade wind. This page applies a rule drawn from that study to the latest forecast: a day is higher than usual when the average wind along the coast the day before is calm or from the north-west.
The rule was tested on the public records of stings on these beaches before this page was built:
Two rules: the one from the study, and one on trial
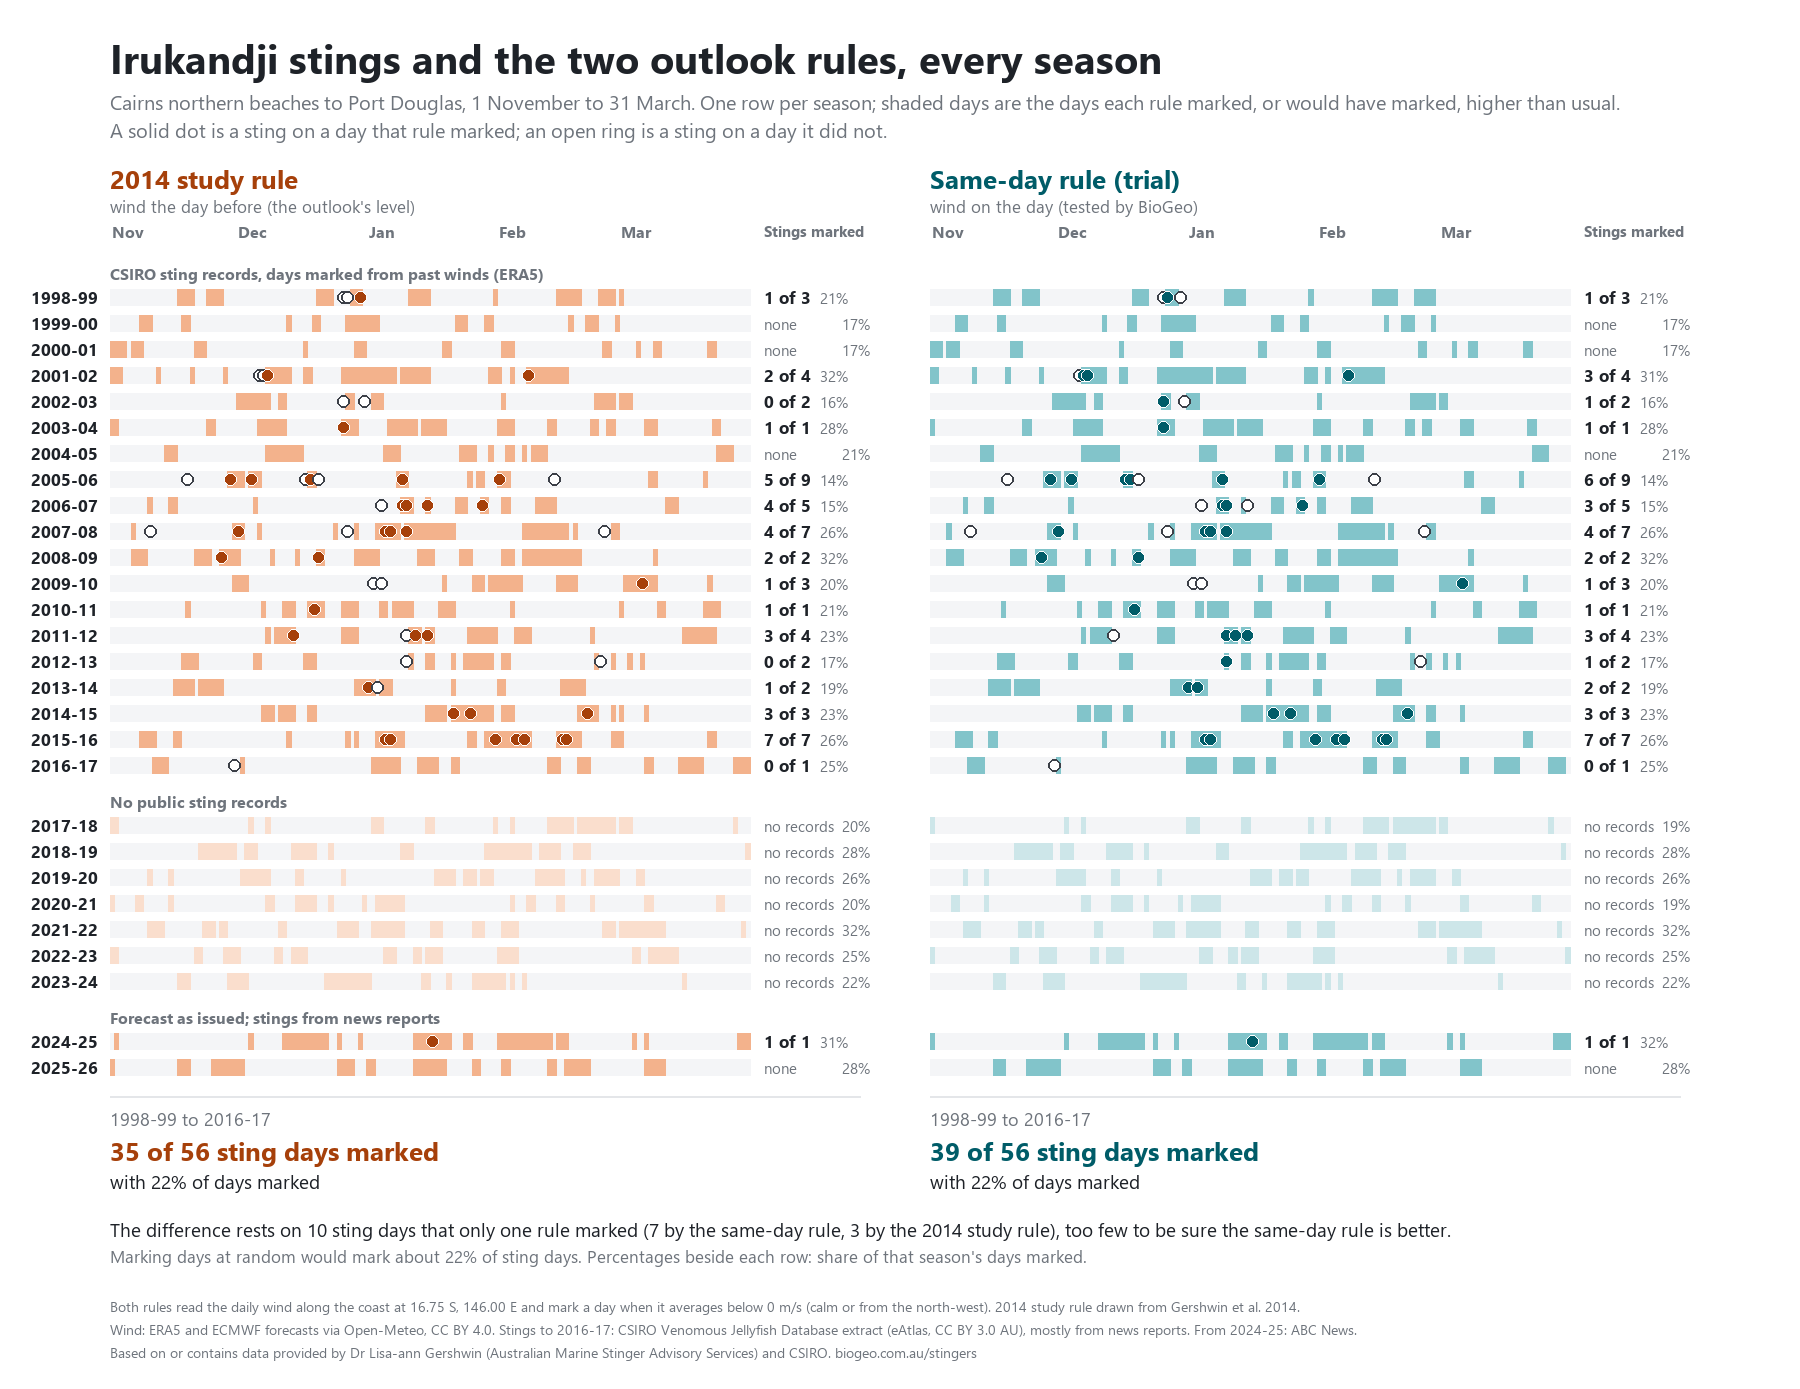
The outlook shows each day under two rules, one row each. The 2014 study rule is drawn from the published research: it judges a day on the wind along the coast the day before, and it colours the map. BioGeo also tested other versions on the same sting records, and one fitted them slightly better: the same test on the wind on the day itself. That is the same-day rule (trial).
From 1998-99 to 2016-17 both rules marked 22% of days. The 2014 study rule marked 35 of the 56 sting days and the same-day rule 39. The difference rests on 10 sting days that only one rule marked, 7 for the same-day rule and 3 for the 2014 study rule, which is too few to be sure the same-day rule is better. It also has to look one day further into the forecast for each day, which makes it a little less reliable further ahead. We will compare the two as new sting records come in.
What it cannot do
Most of the sting records come from news reports, so they are few and miss many stings. Calm days also bring more people into the water, and the records cannot tell that apart from more jellyfish. The outlook covers the mainland beaches from Cairns to Port Douglas, not the islands or the reef. It was tested on November to March, and the forecast further out is more likely to change.
This is an experimental outlook from public data, made by BioGeo. It is not a warning service, it can be wrong, and it never means a beach is safe.