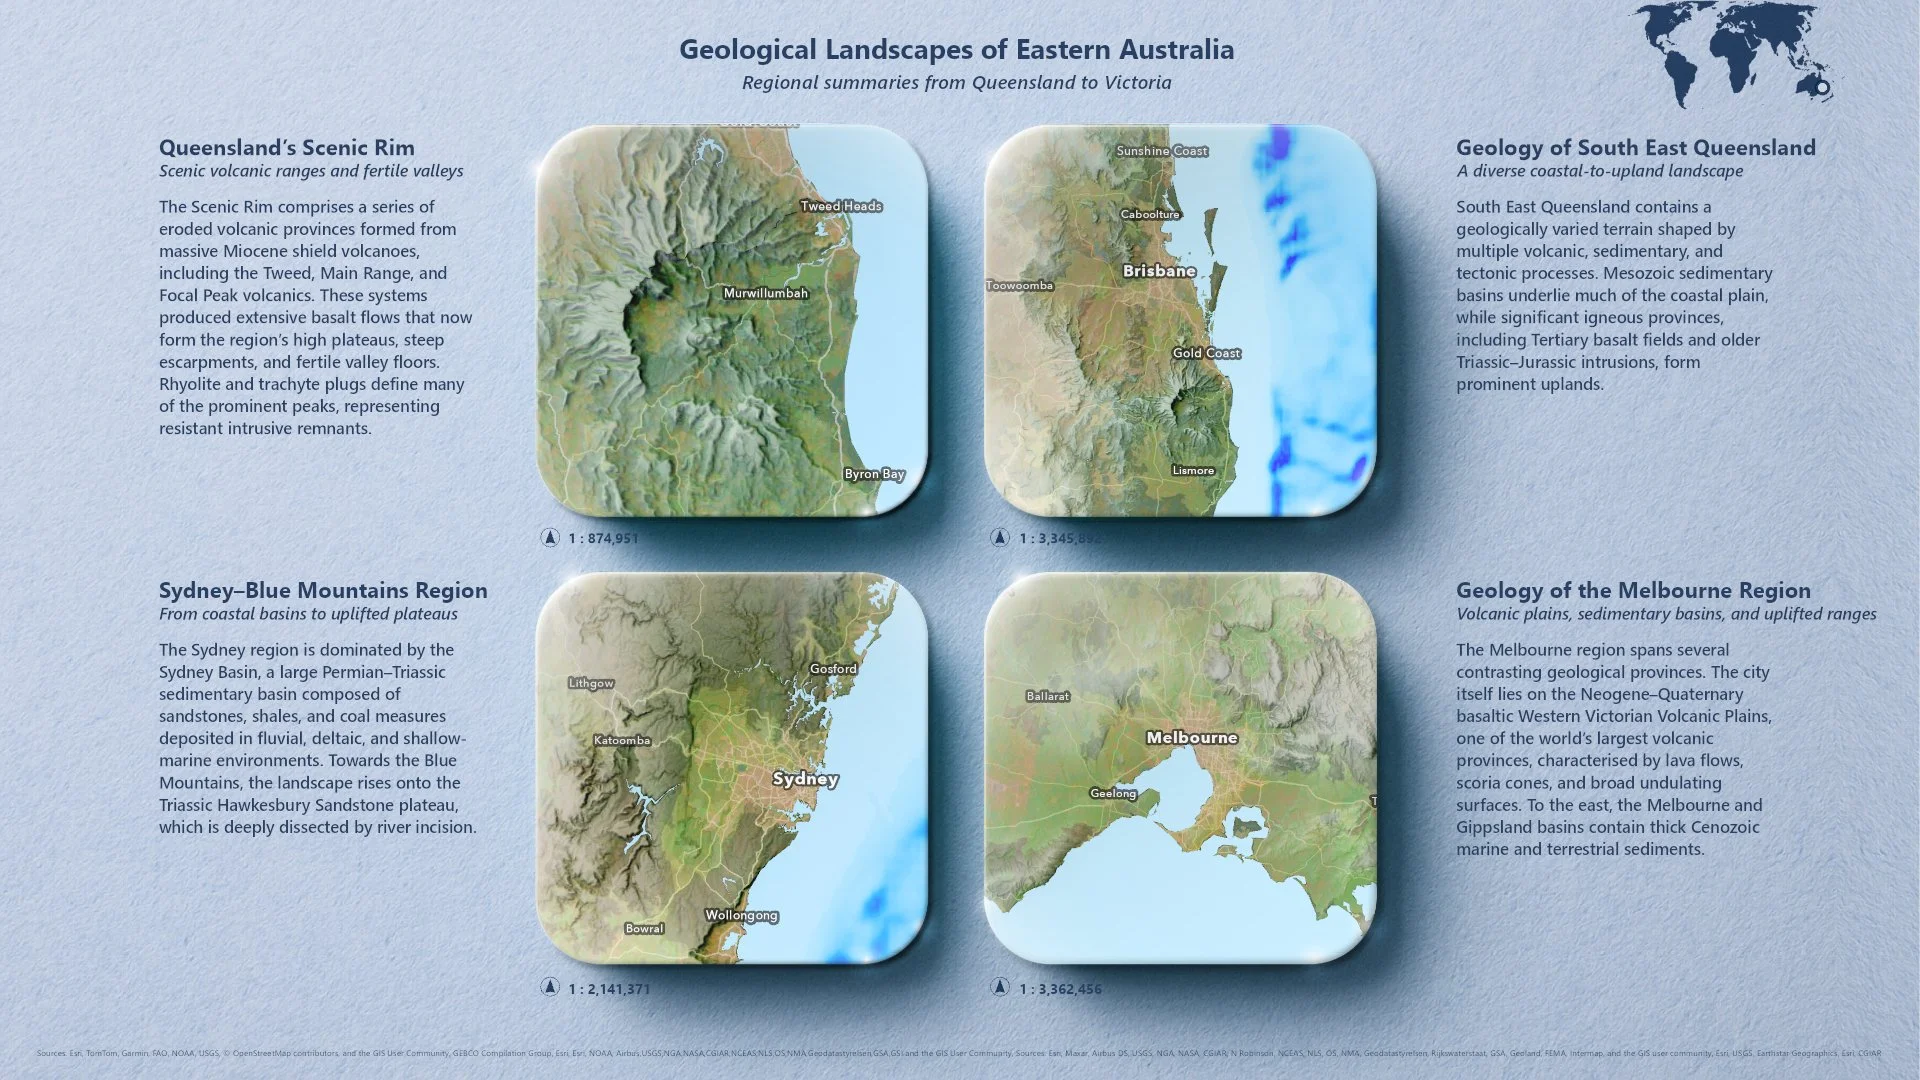
Regional Geology Maps Presented as Blocks
John Nelson–inspired maps produced in ArcGIS Pro, arranged in a single layout to illustrate the geological diversity of the Scenic Rim, South East Queensland, Sydney–Blue Mountains, and Melbourne regions. Each block was exported individually and styled with subtle shadowing to create depth.
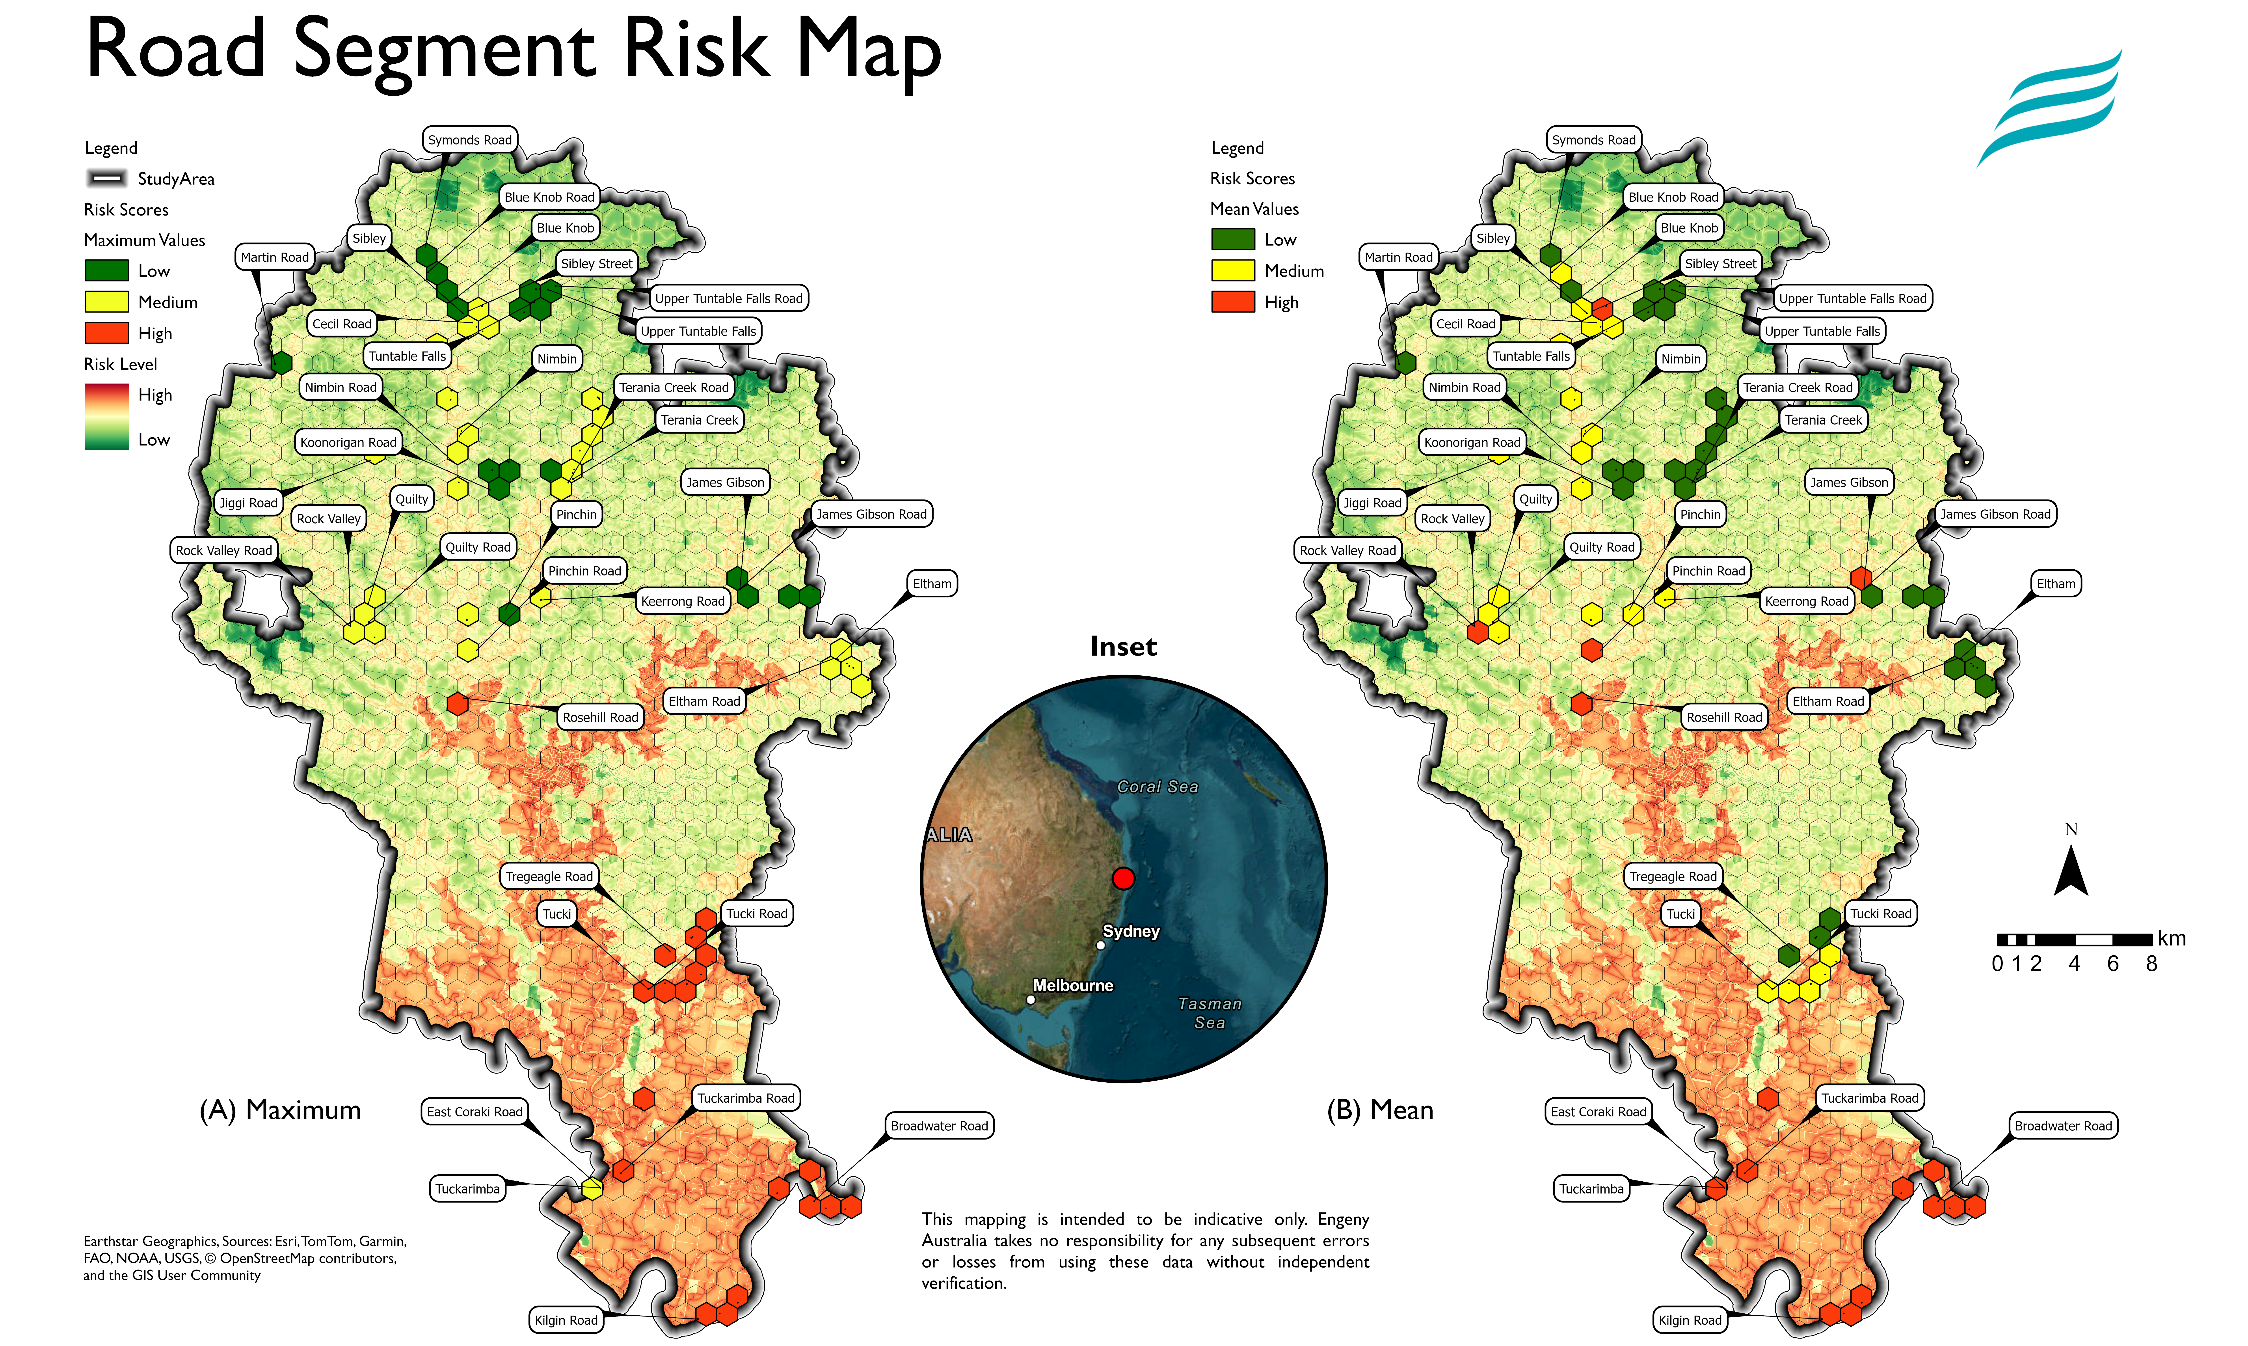
Road Upgrade Risk Assessment Map
Spatial risk assessment used to prioritise road-upgrade works. A graded risk surface derived from elevation, flood extent, drainage proximity, land use, and land-tenure inputs highlights where upgrades are likely to be most constrained. The road network is segmented into High, Medium, and Low risk based on zonal statistics.
Habitat Suitability — Brush-Tailed Rock Wallaby
Final output from a weighted overlay analysis determining habitat suitability levels for the brush-tailed rock wallaby, produced for the Wildlife Preservation Society Queensland. Three priority areas were identified within remnant vegetation with high terrain roughness and proximity to previous sightings.
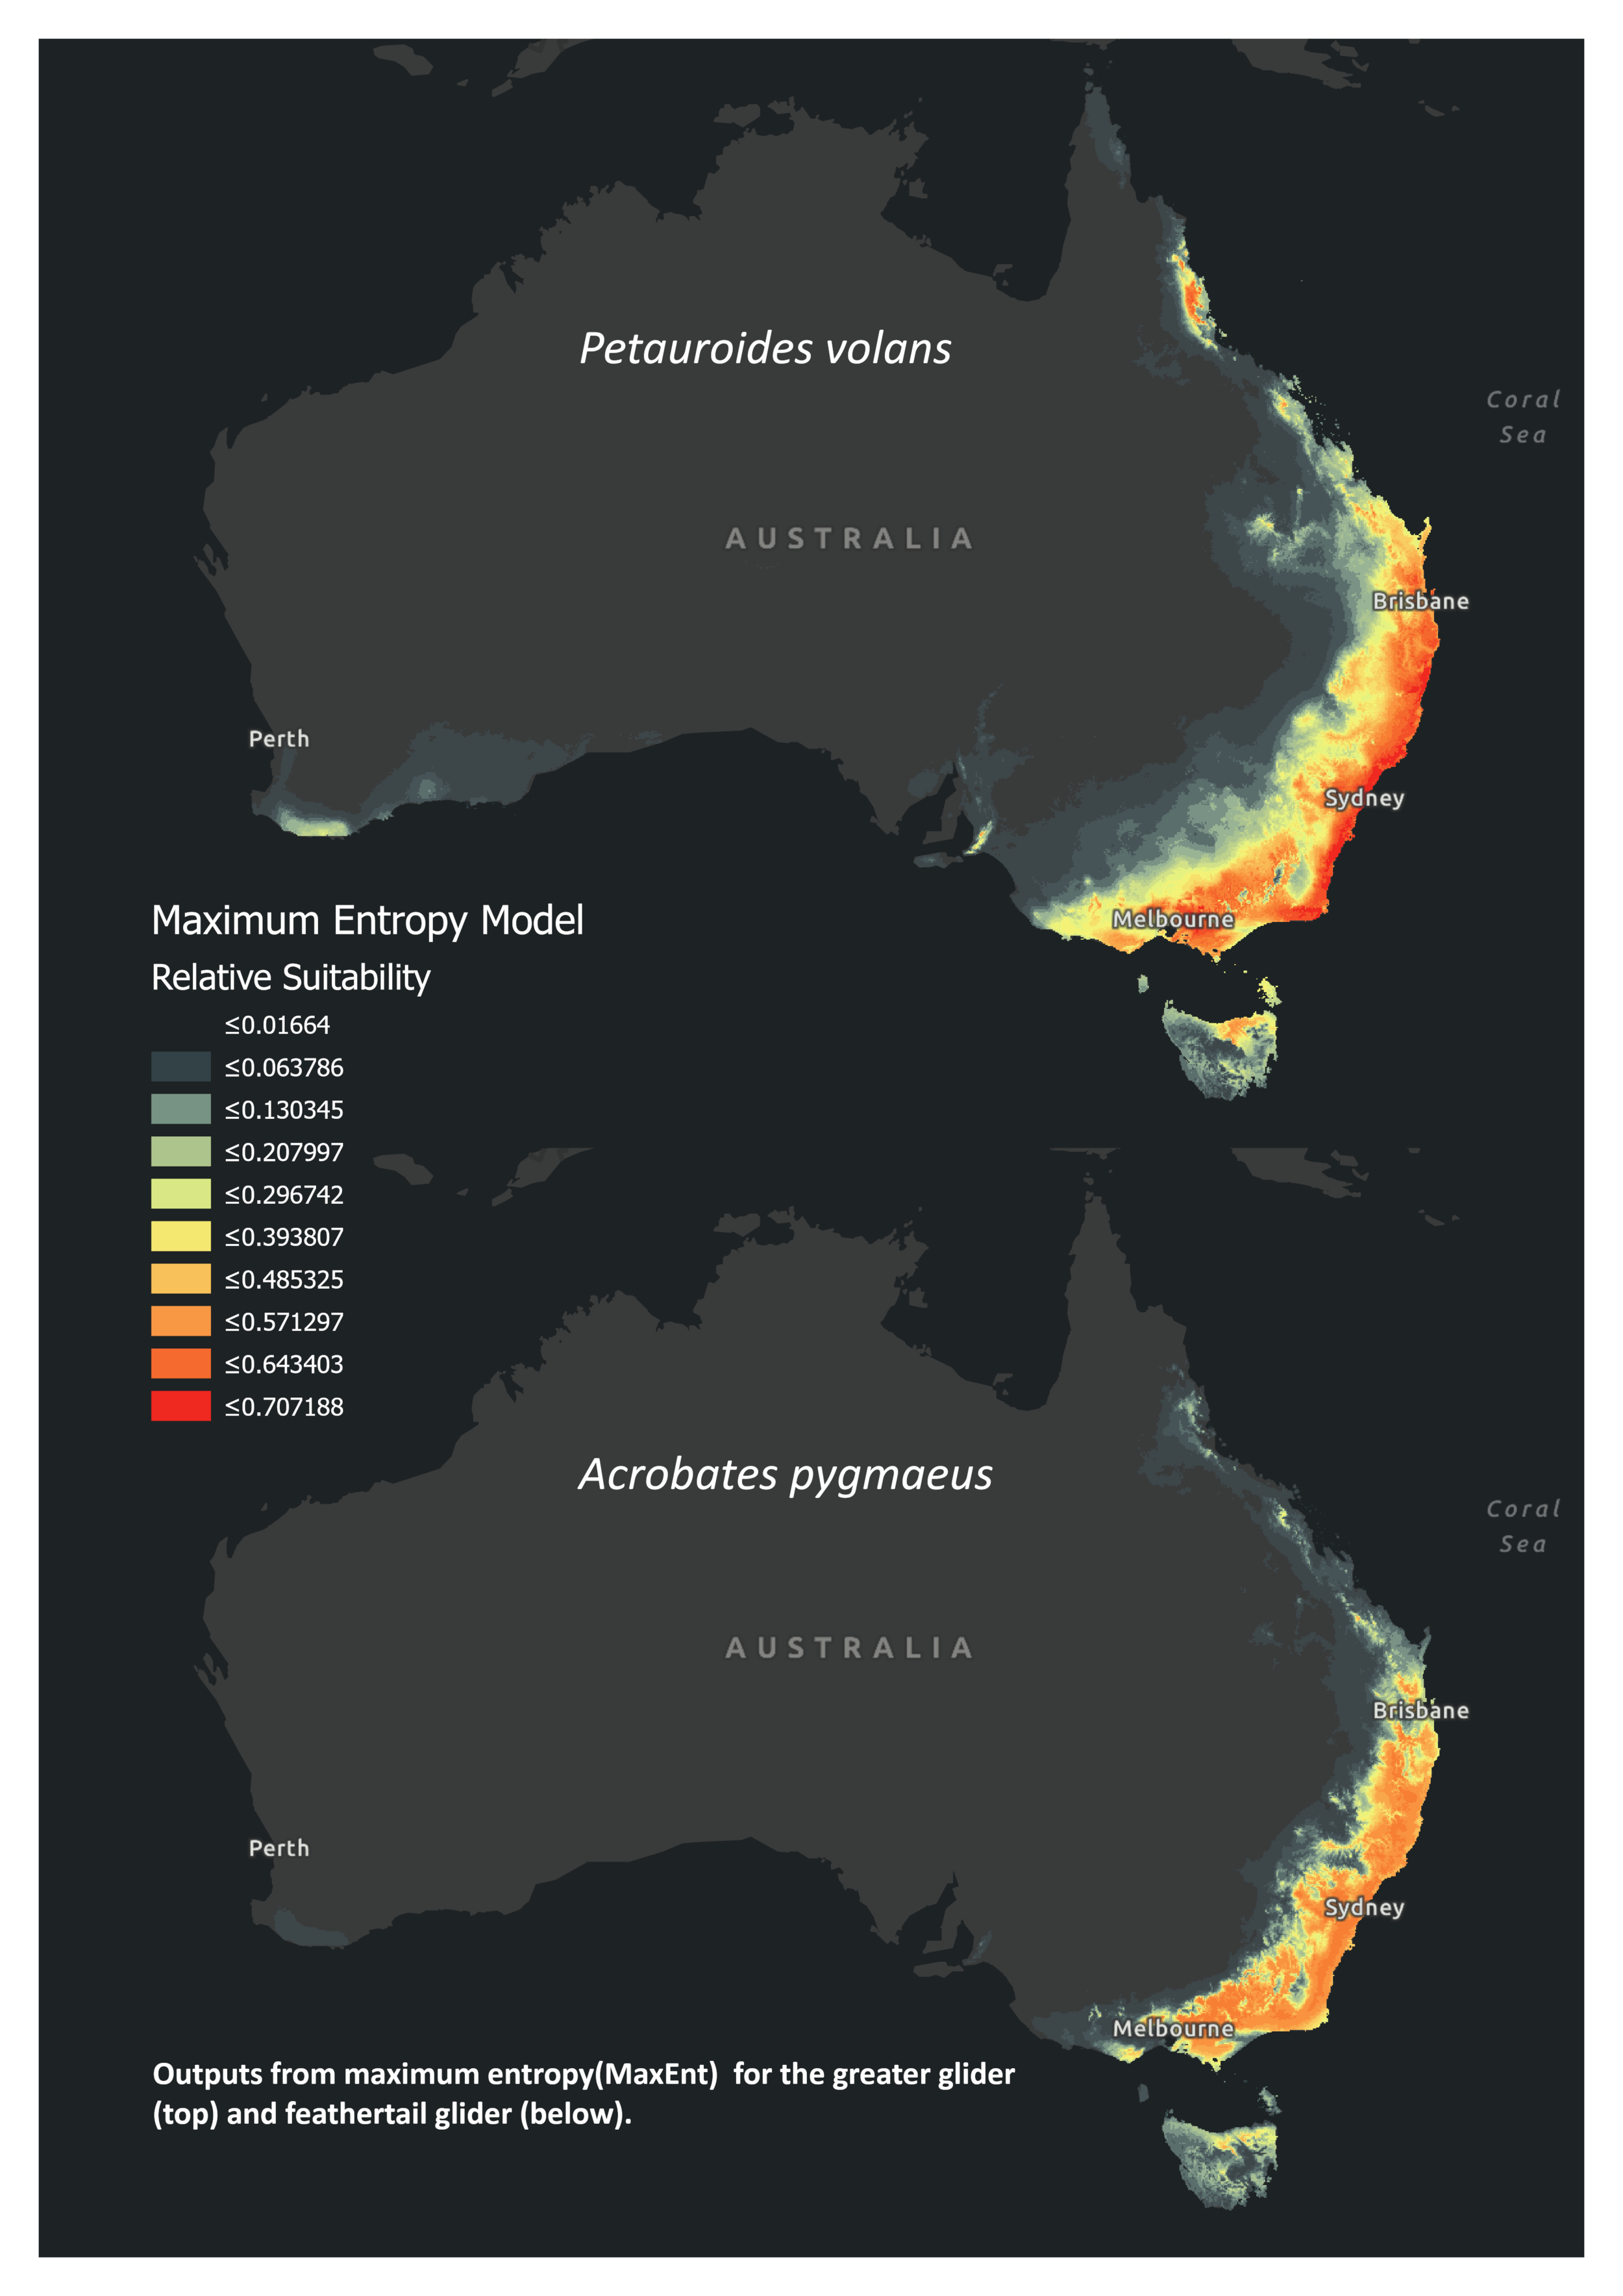
MaxEnt Model Outputs — Predicting Habitat Suitability
Habitat suitability maps produced from maximum entropy (MaxEnt) models. The upper map represents suitability scores for the greater glider and the lower for the feather-tailed glider. Models were generated in R with resultant rasters imported into a GIS for styling and symbology.
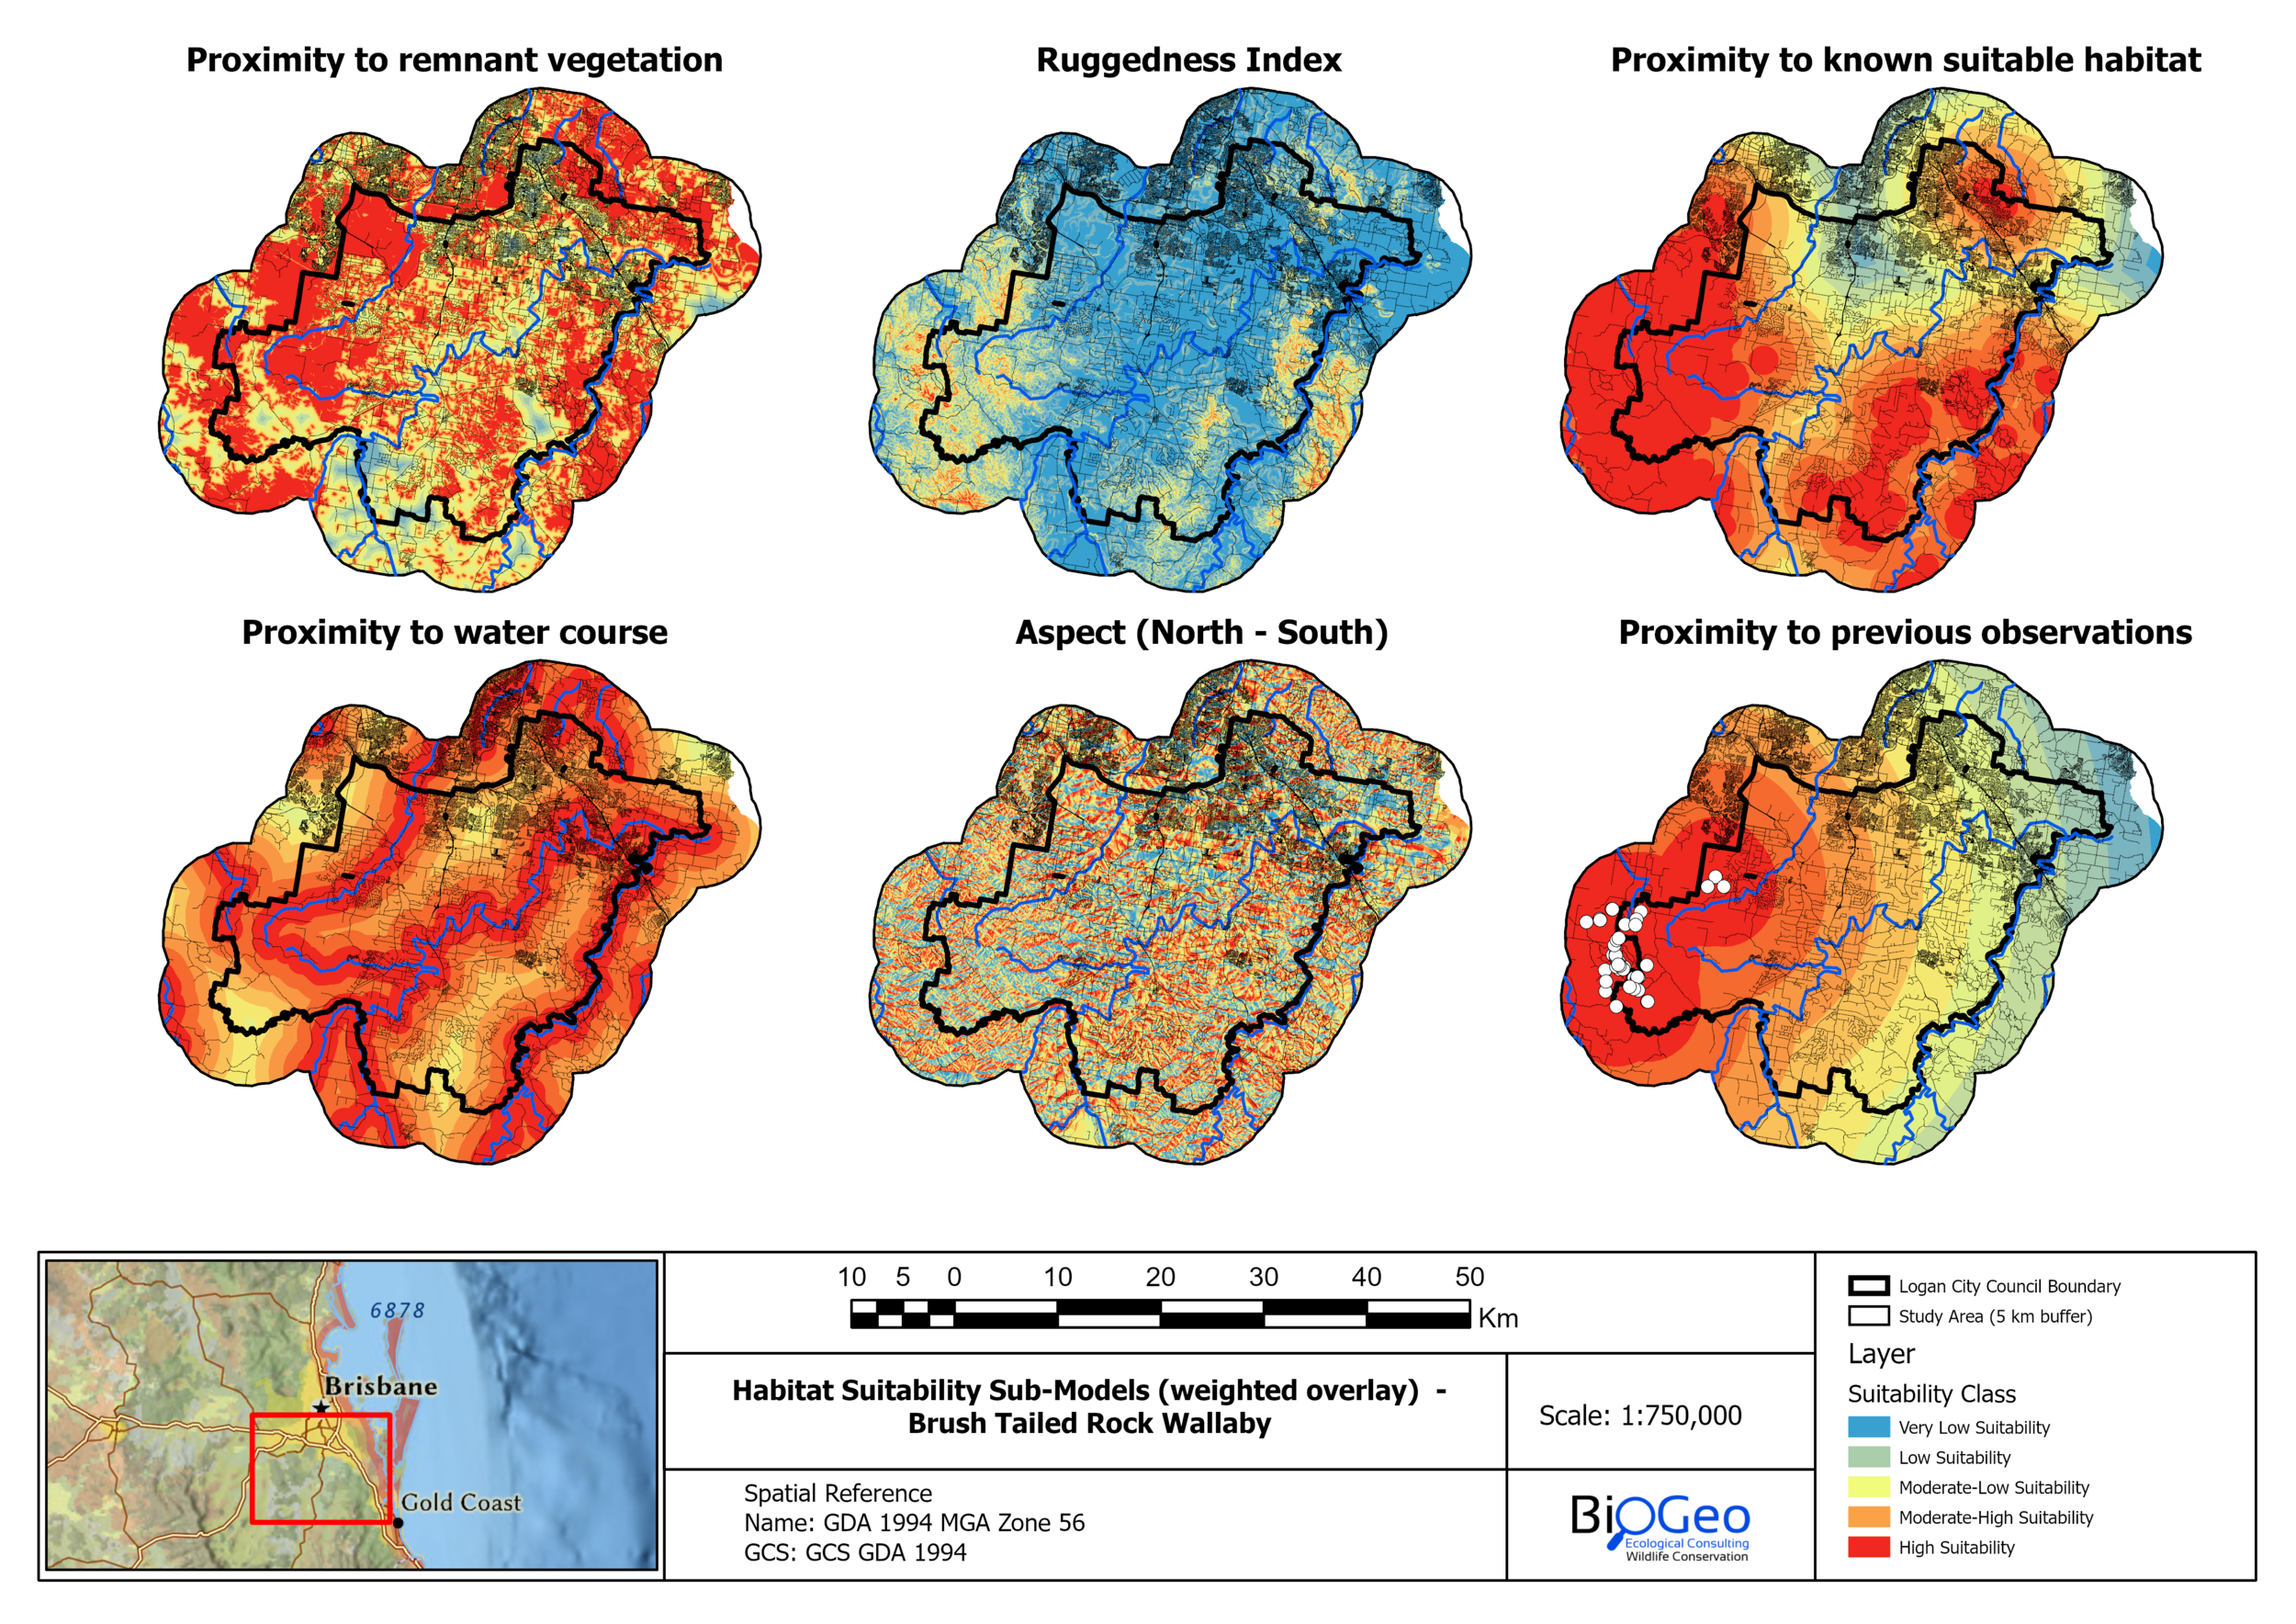
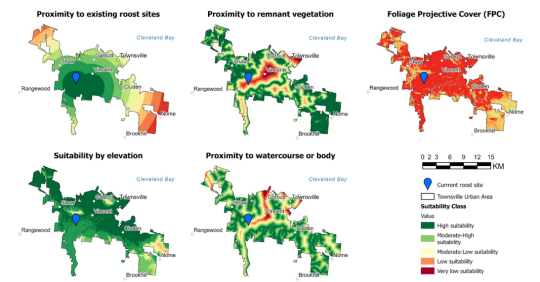
Habitat Suitability Sub-Models
Individual sub-models identifying desirable habitat areas for the brush-tailed rock wallaby based on specific habitat requirements — remnant vegetation, habitat type, terrain roughness index (predator refugia proxy), aspect, distance from watercourse, and previously recorded sightings.
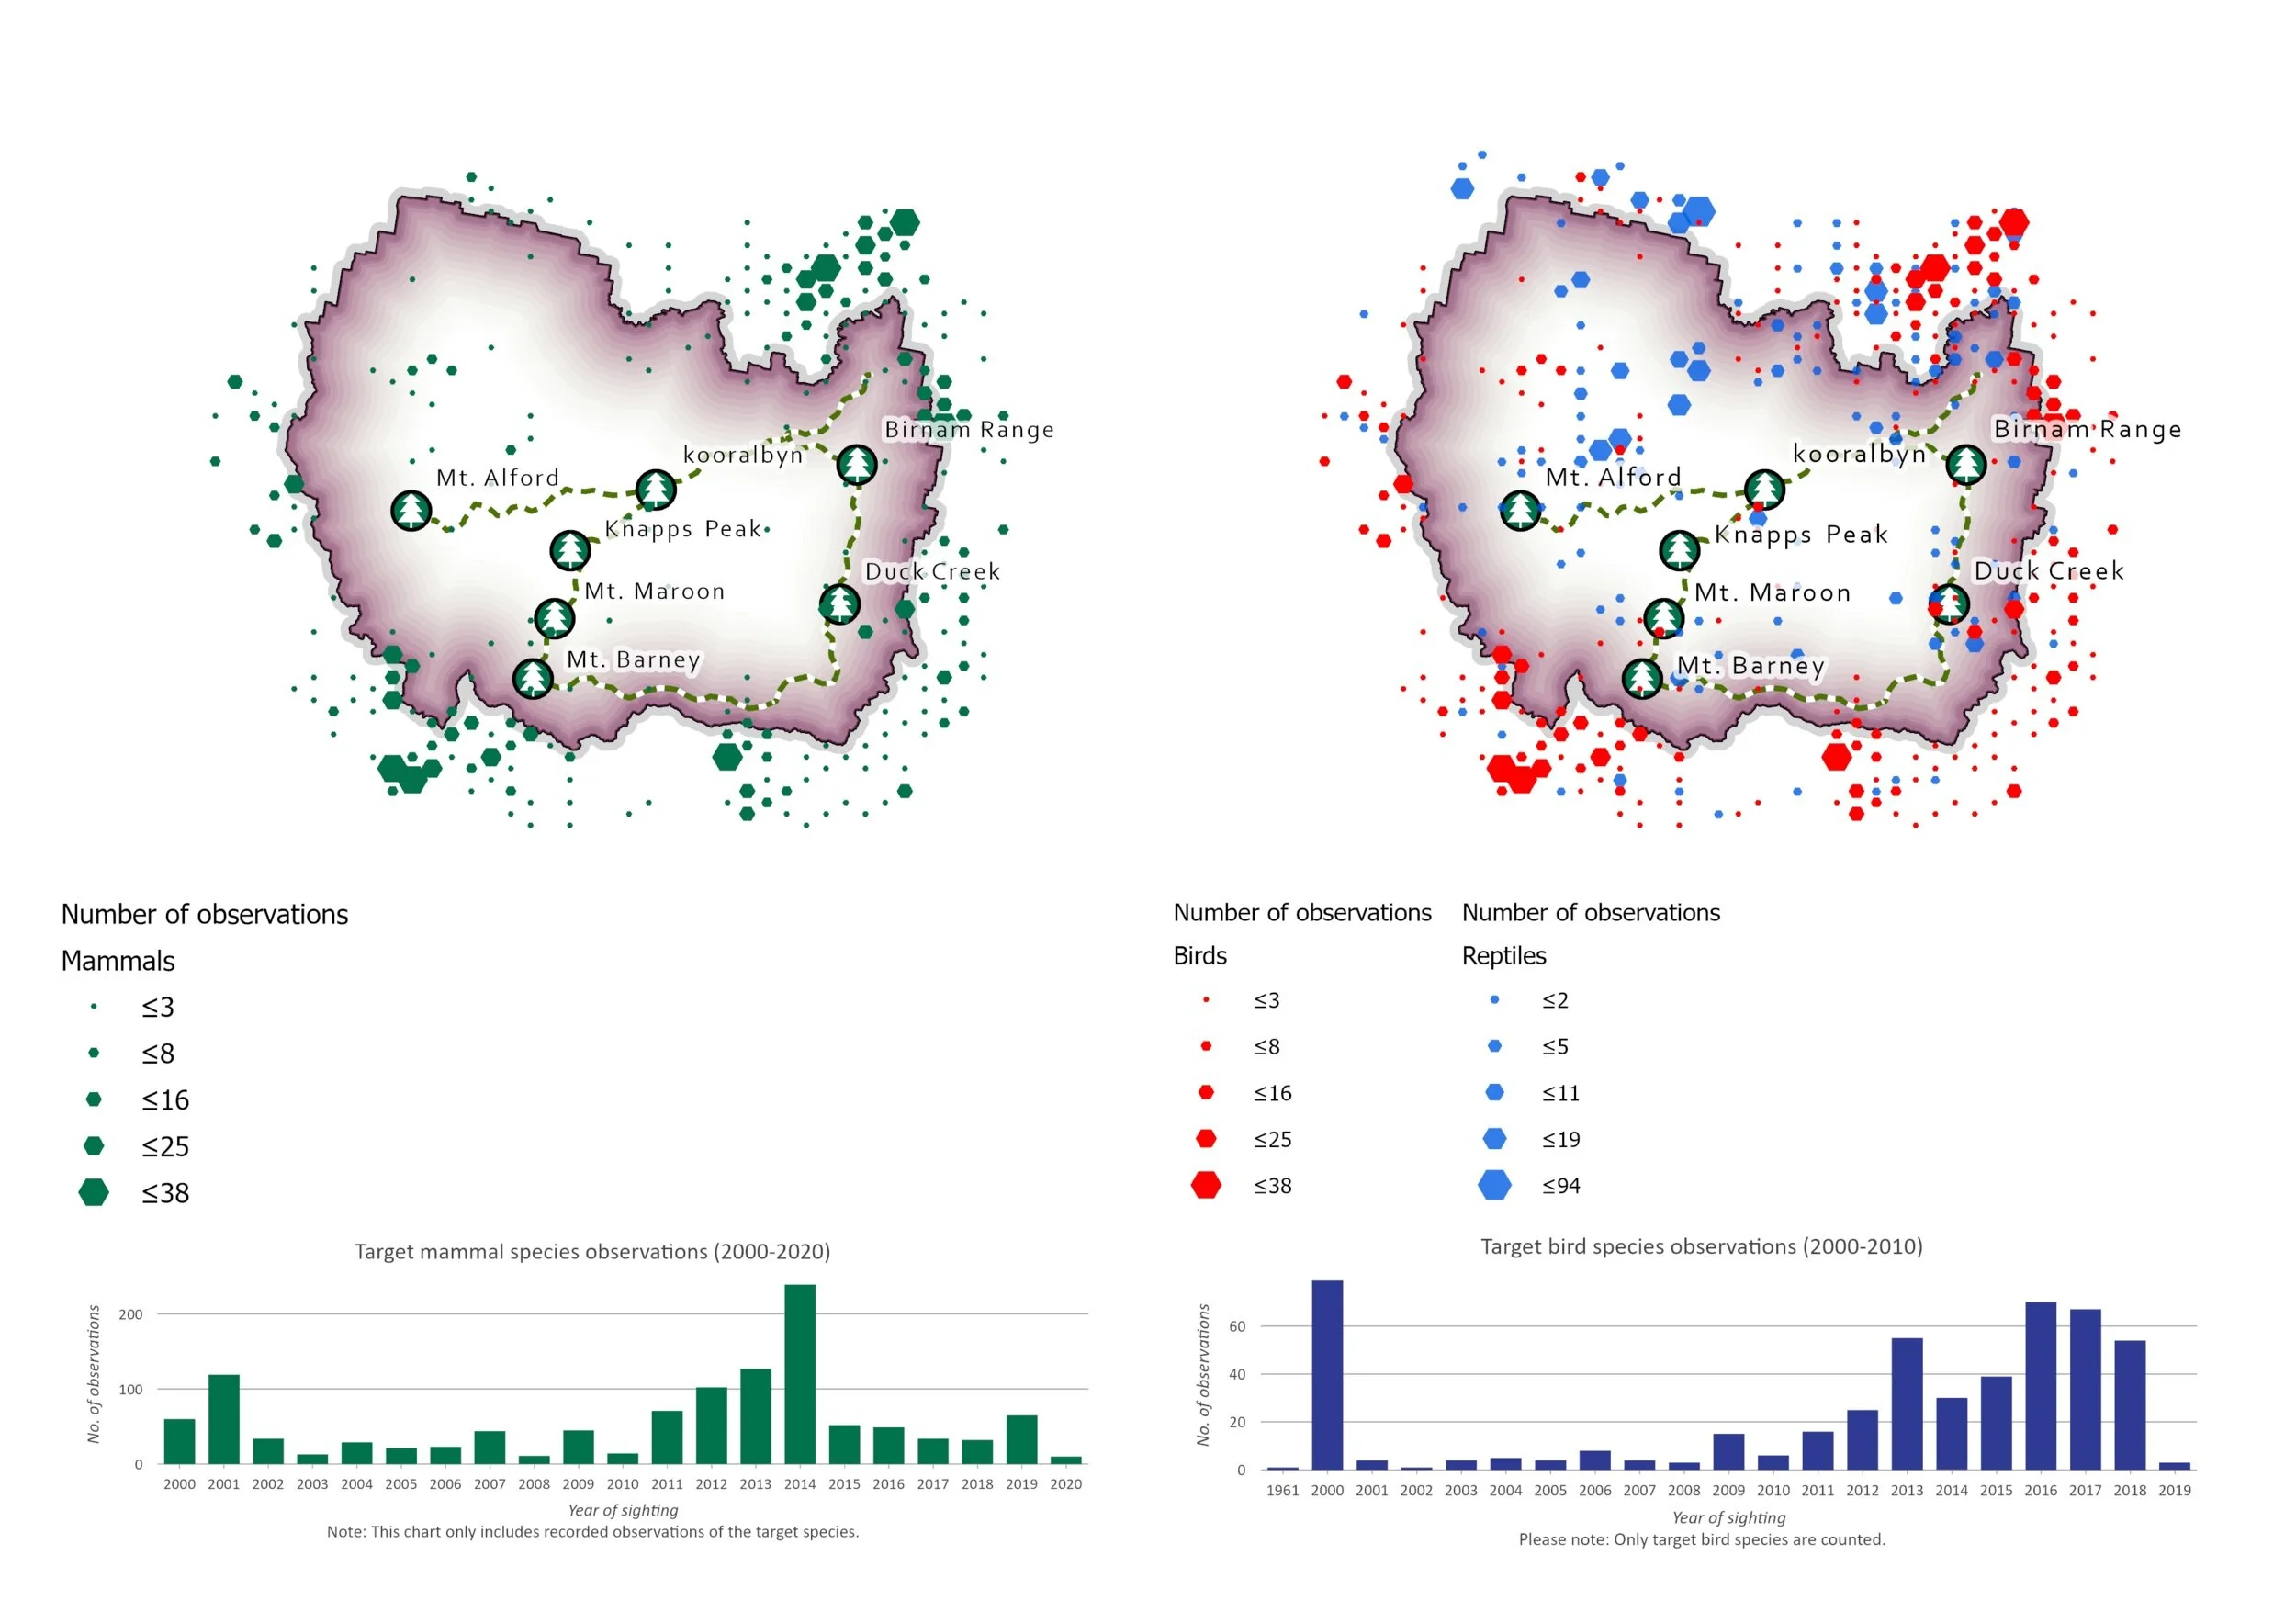
Target Species Observations — Scenic Rim
Abundance and distribution of species illustrated using hex-bin grid cells. The charts below the map provide the temporal distribution of observational data across the Scenic Rim study area.
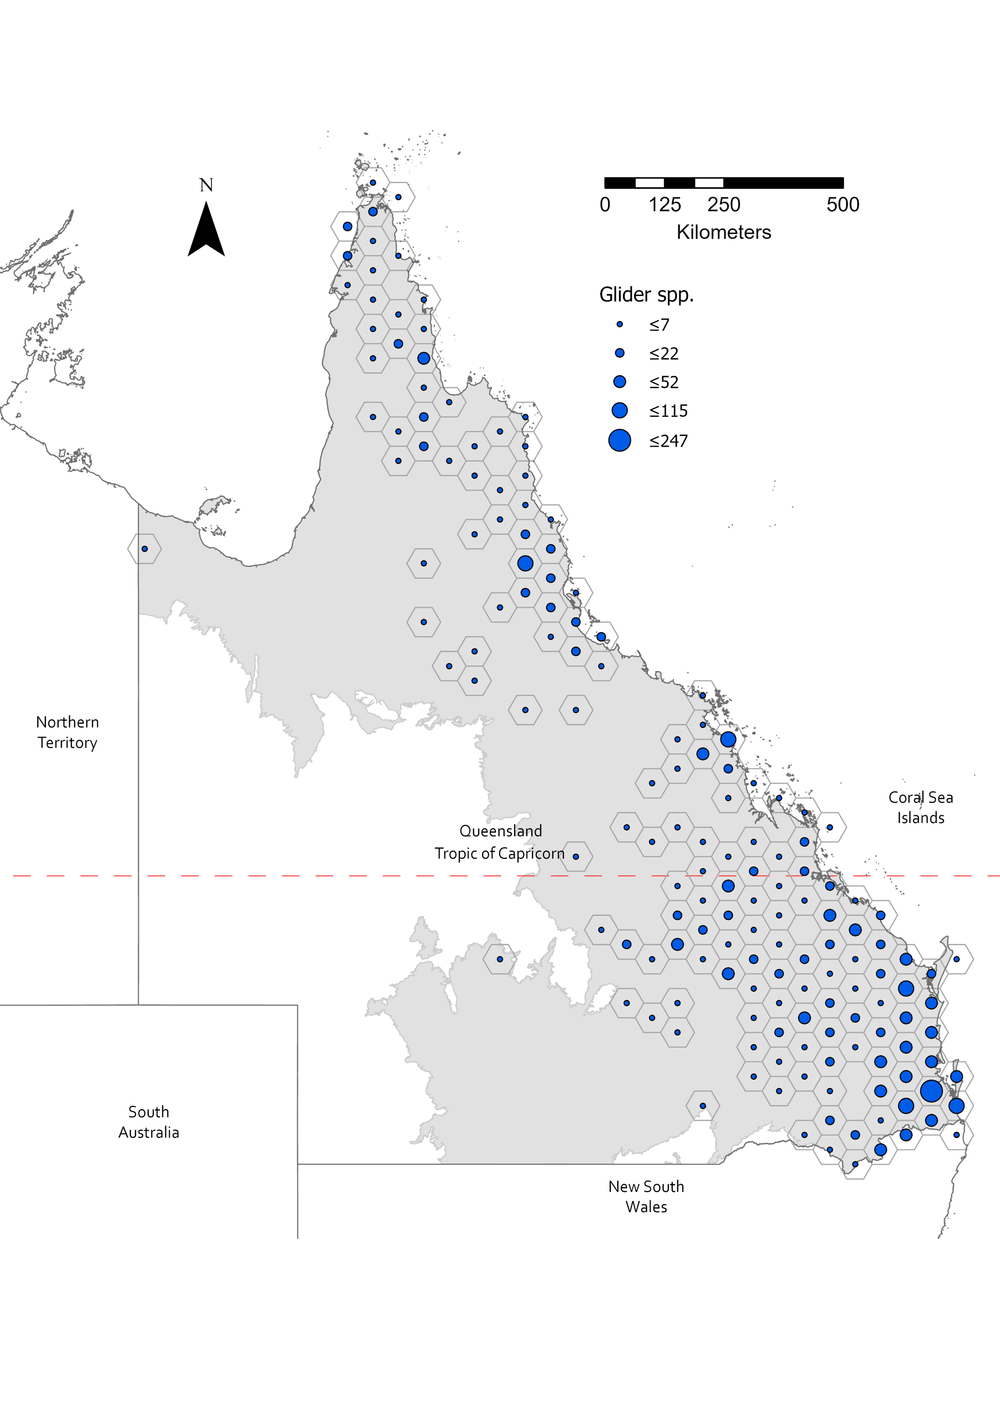
Distribution of Gliders across Queensland
Hex-bin cell visualisation summarising the distribution of multiple glider species across Queensland bioregions, produced to support a report on Queensland glider populations.
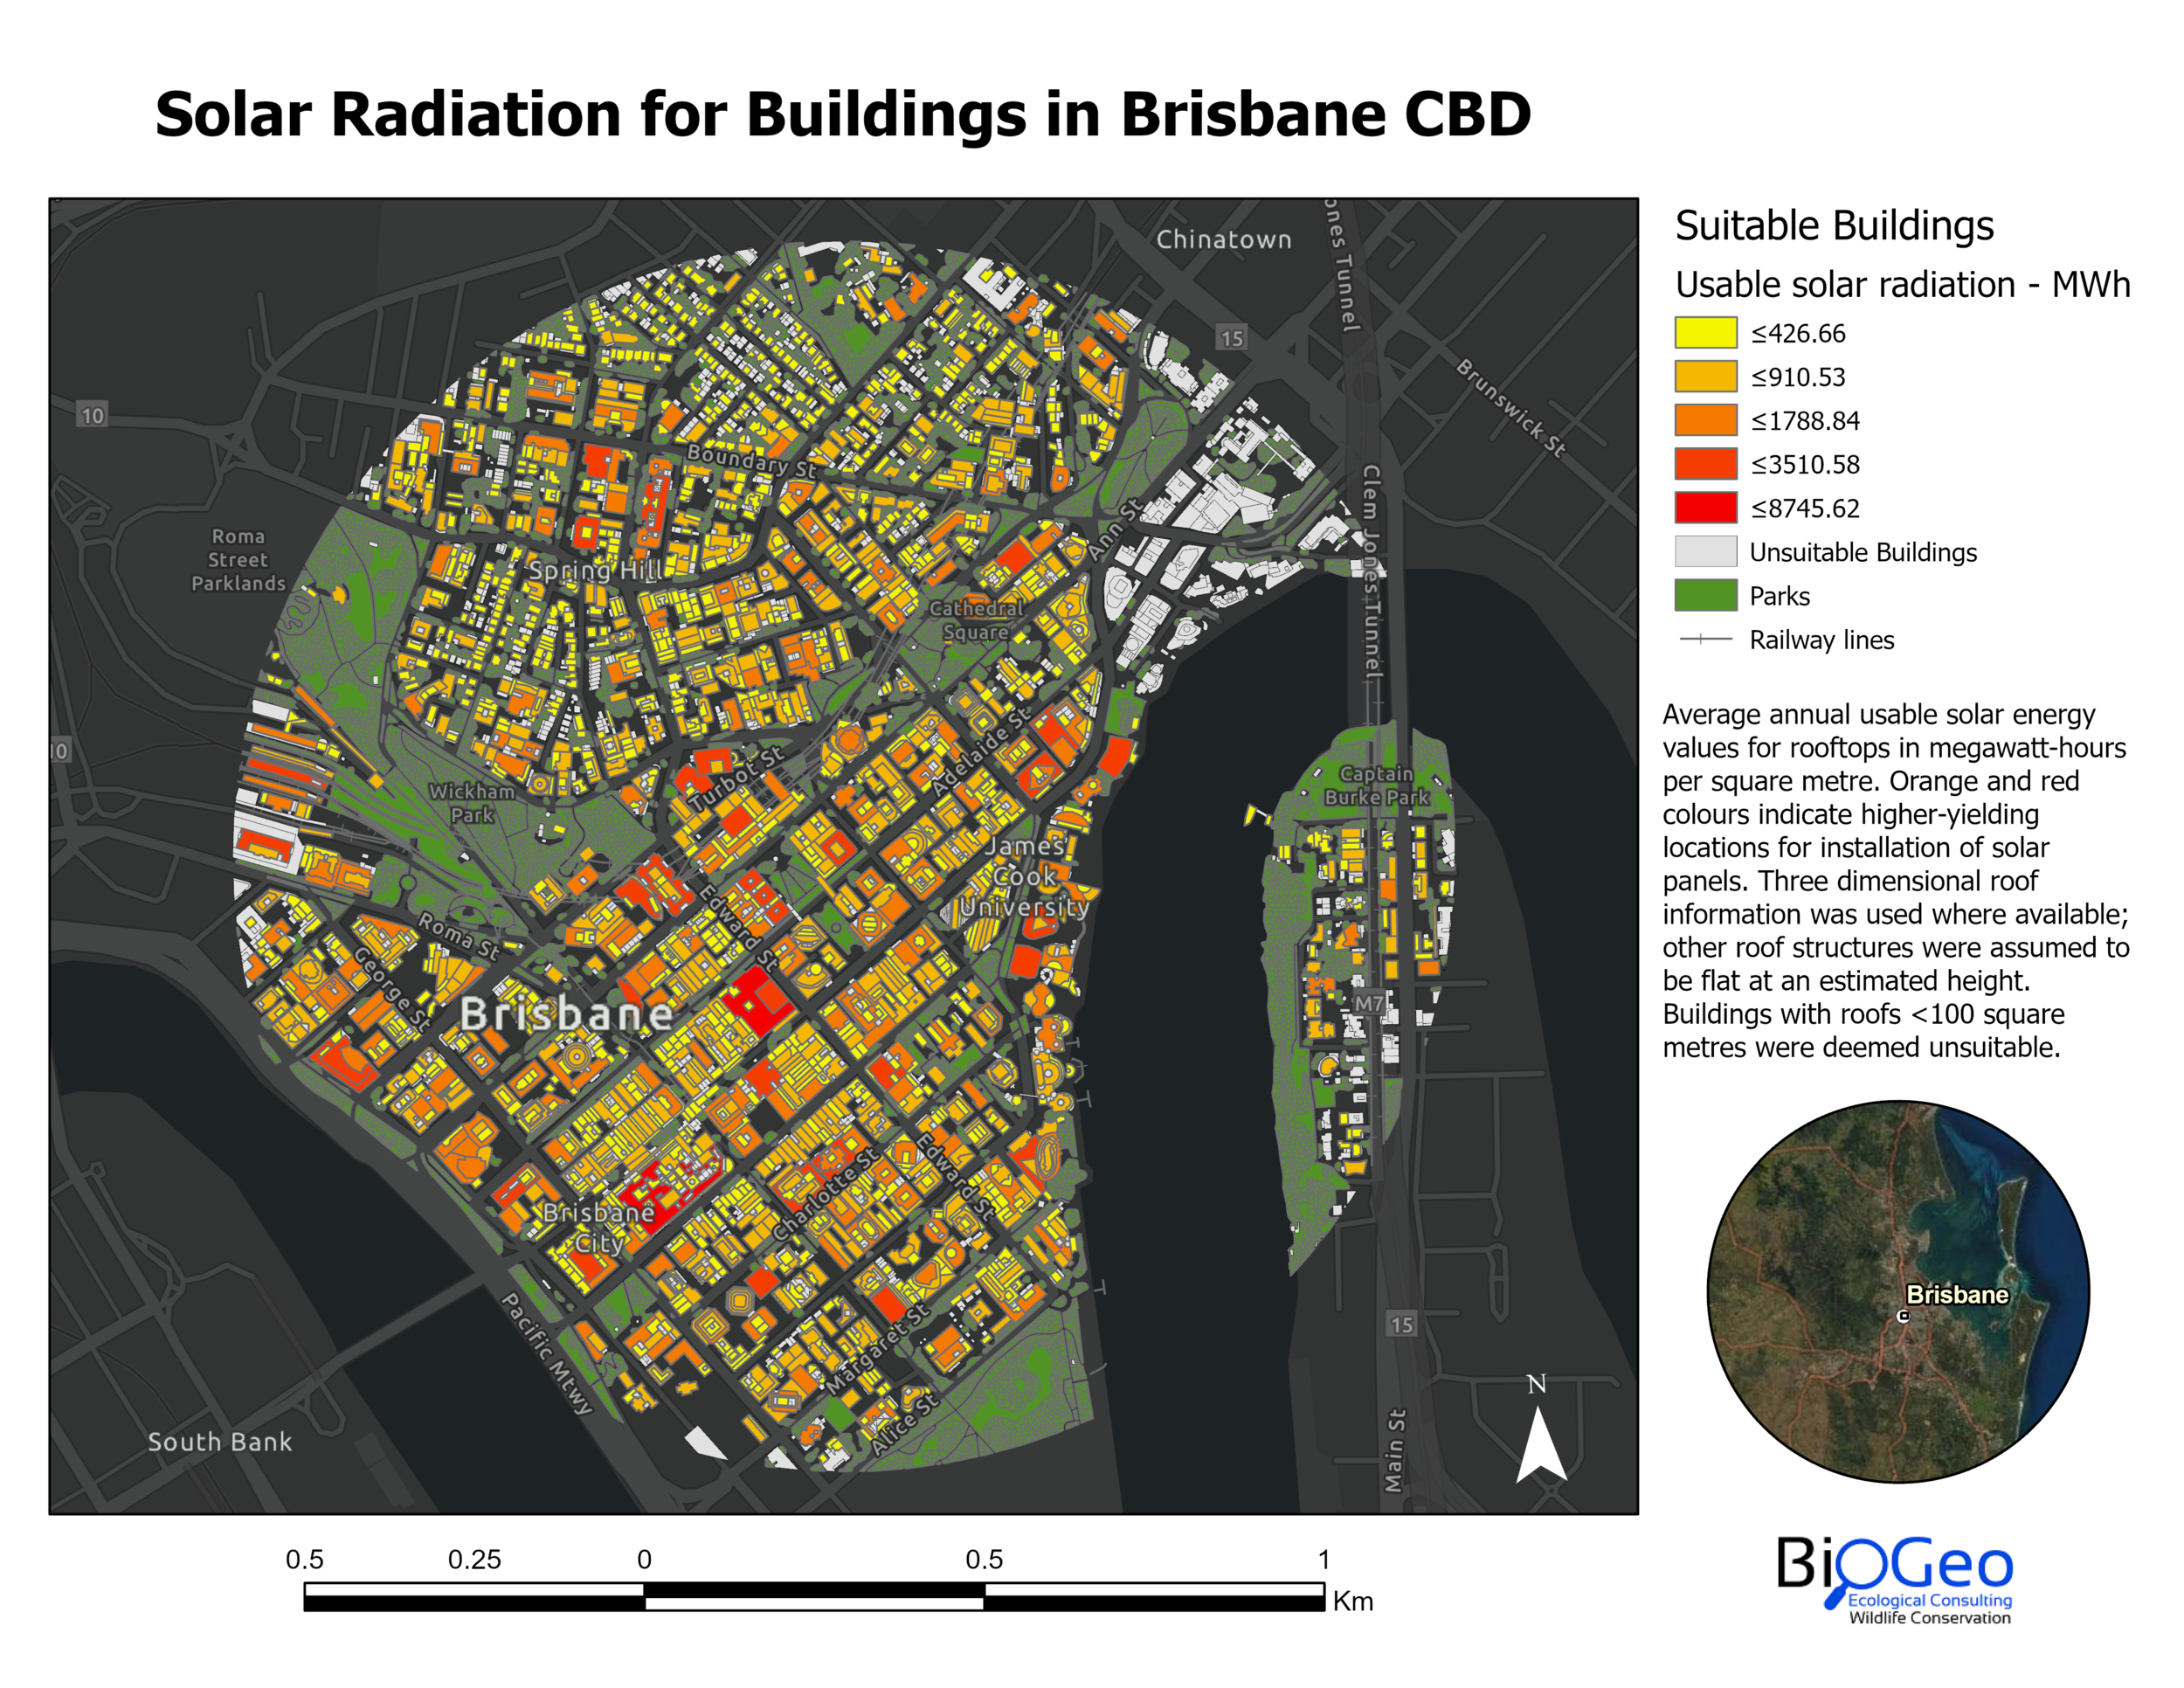
Usable Solar Radiation — Central Brisbane CBD
Average annual usable energy for rooftops in Brisbane's CBD (megawatt-hours per square metre). Three-dimensional building data was used to calculate elevation, slope, and aspect of each roof space to estimate annual energy yields. Orange and red indicate higher-yielding locations.
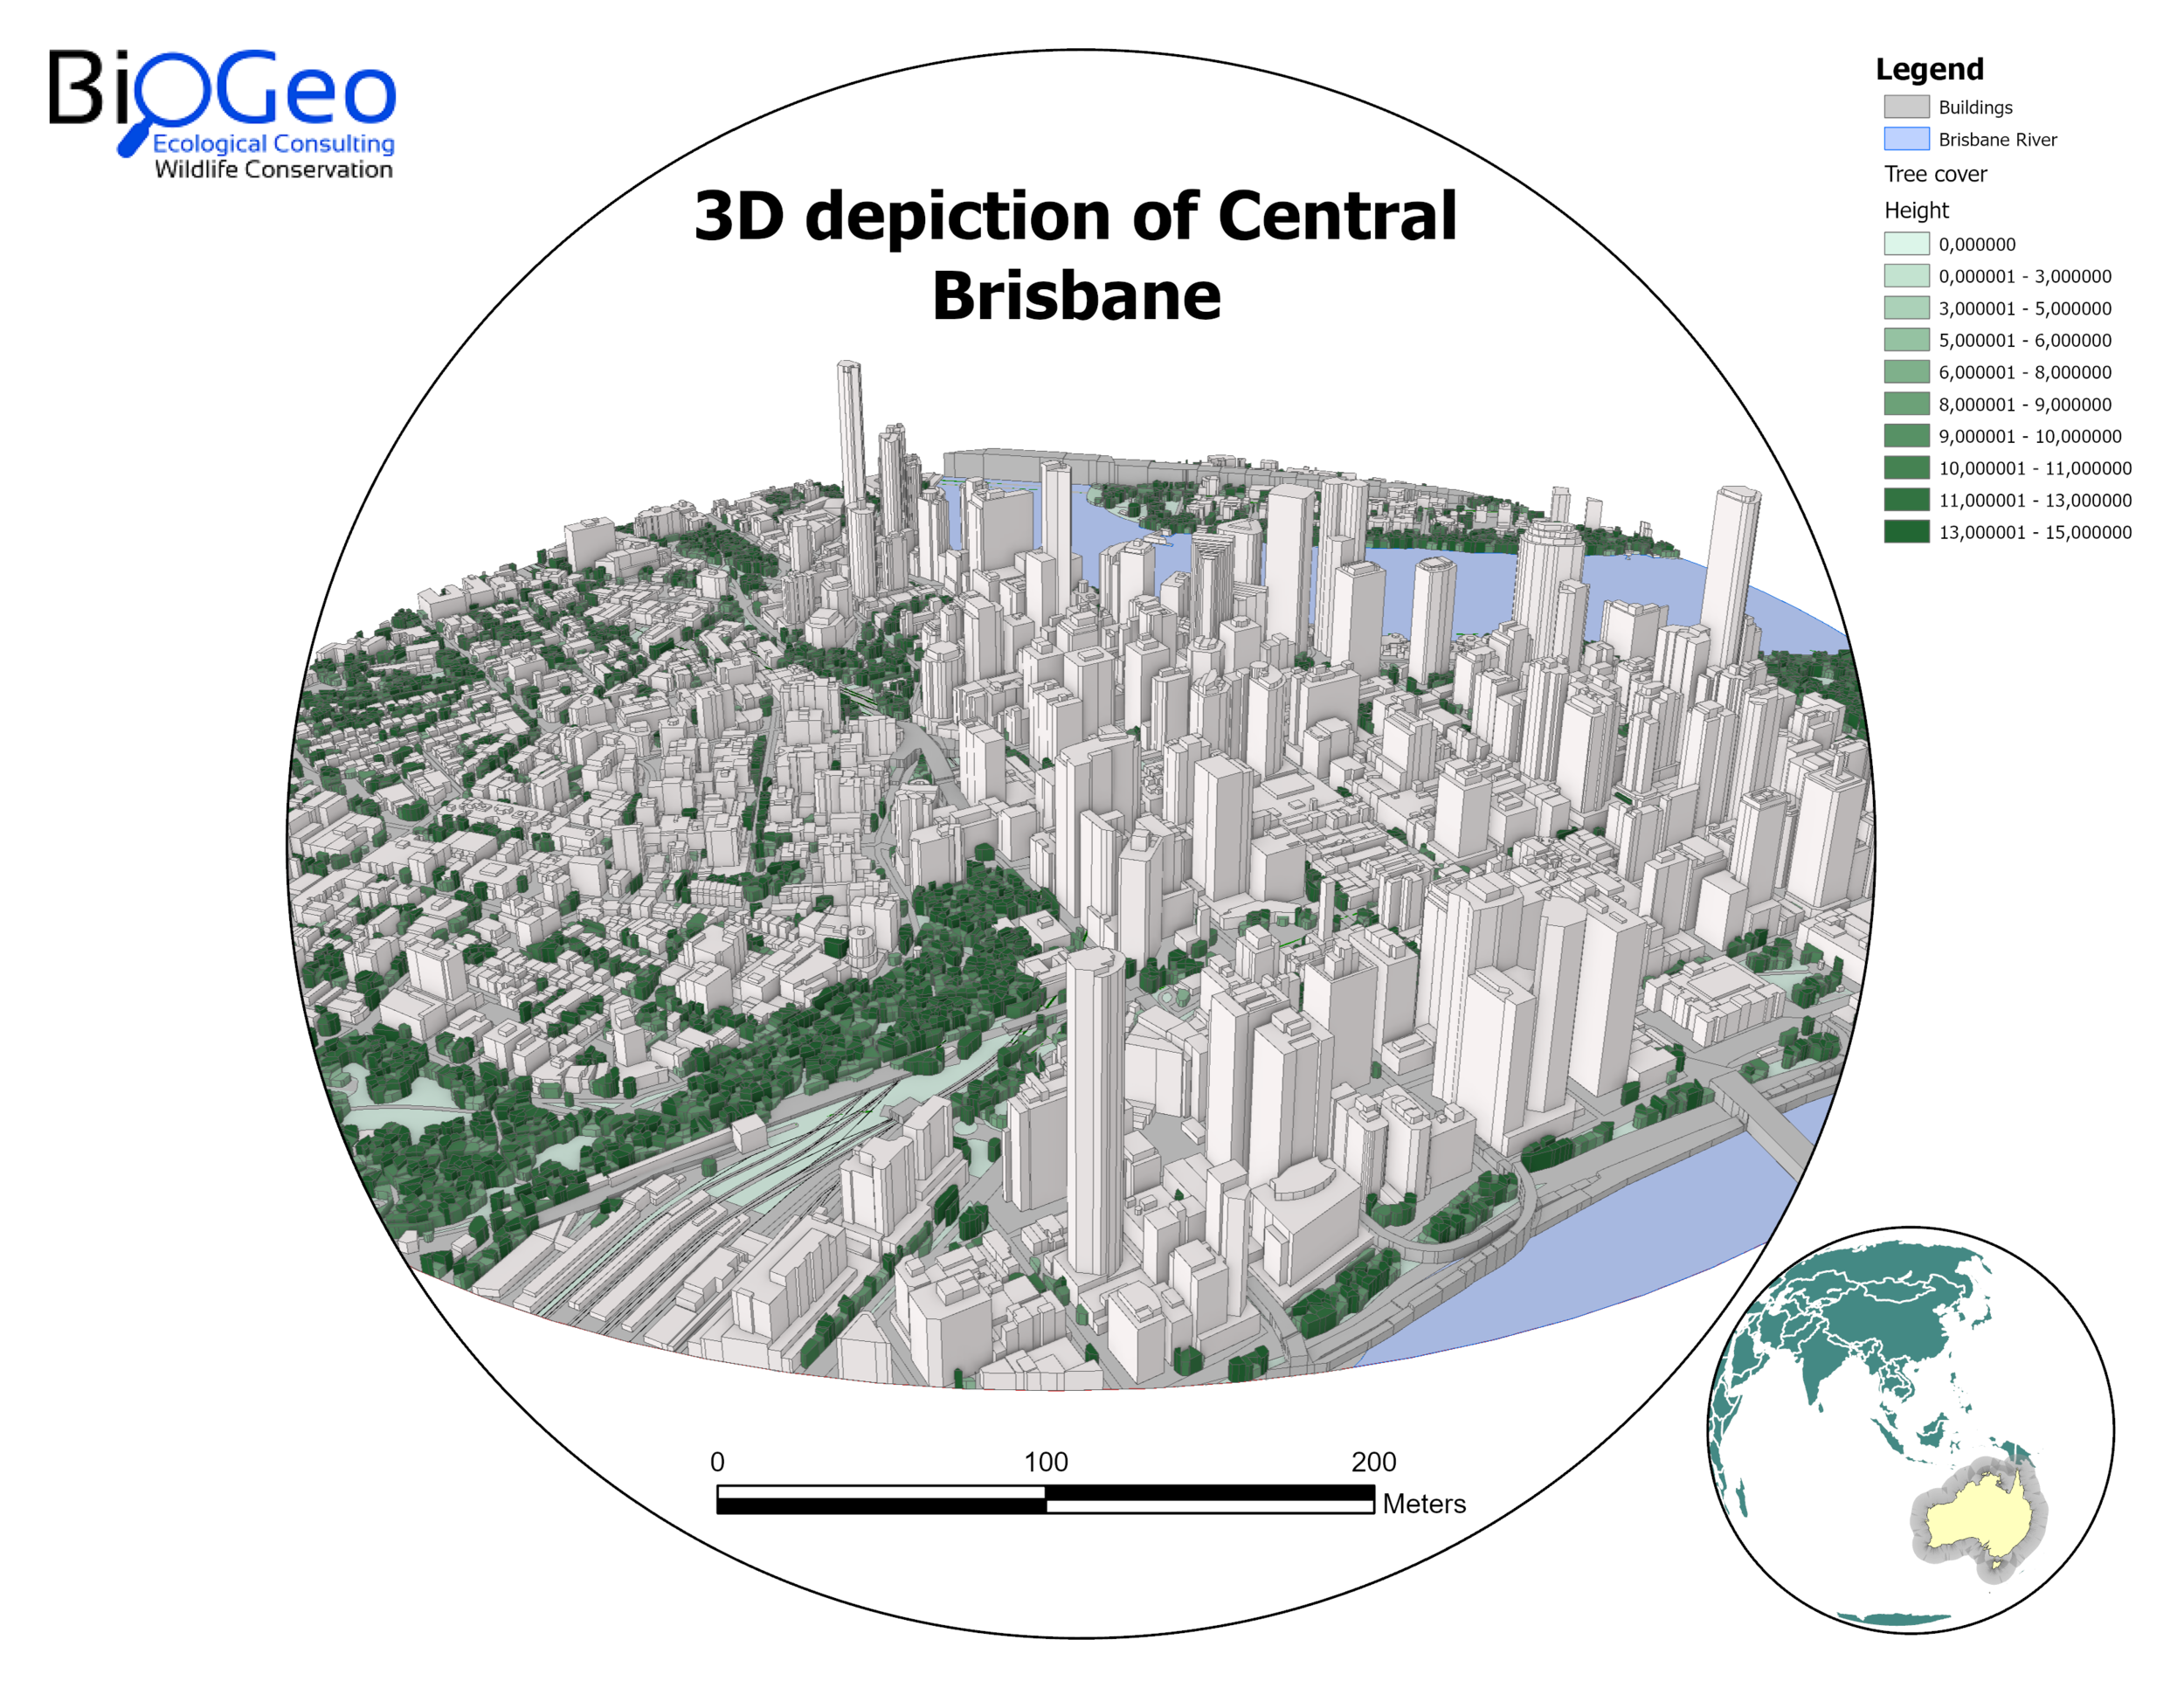
Three-Dimensional View of Central Brisbane
Three-dimensional cartographic representation of Brisbane's CBD with globe-style inset map, produced to demonstrate advanced 3D mapping capabilities in ArcGIS Pro.
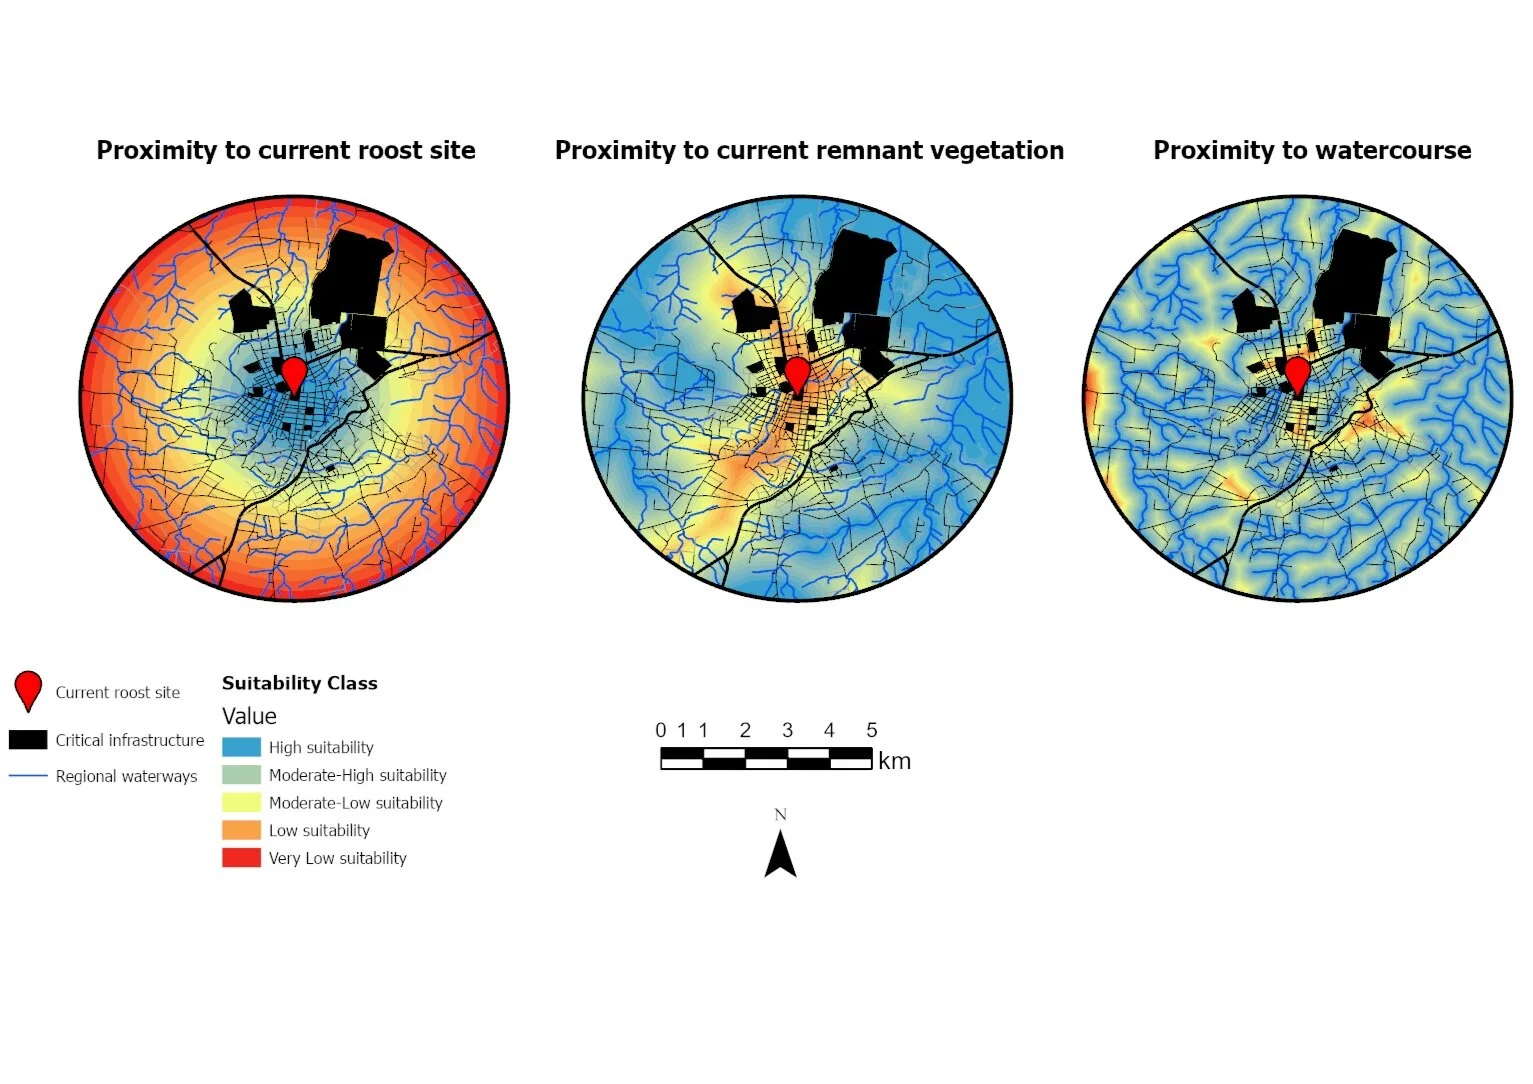
Species Reintroduction Suitability Sub-Models
Sub-models identifying desirable areas for reintroduction of a specific species into the wild, integrating habitat characteristics, terrain, and ecological constraints to rank candidate sites by suitability.
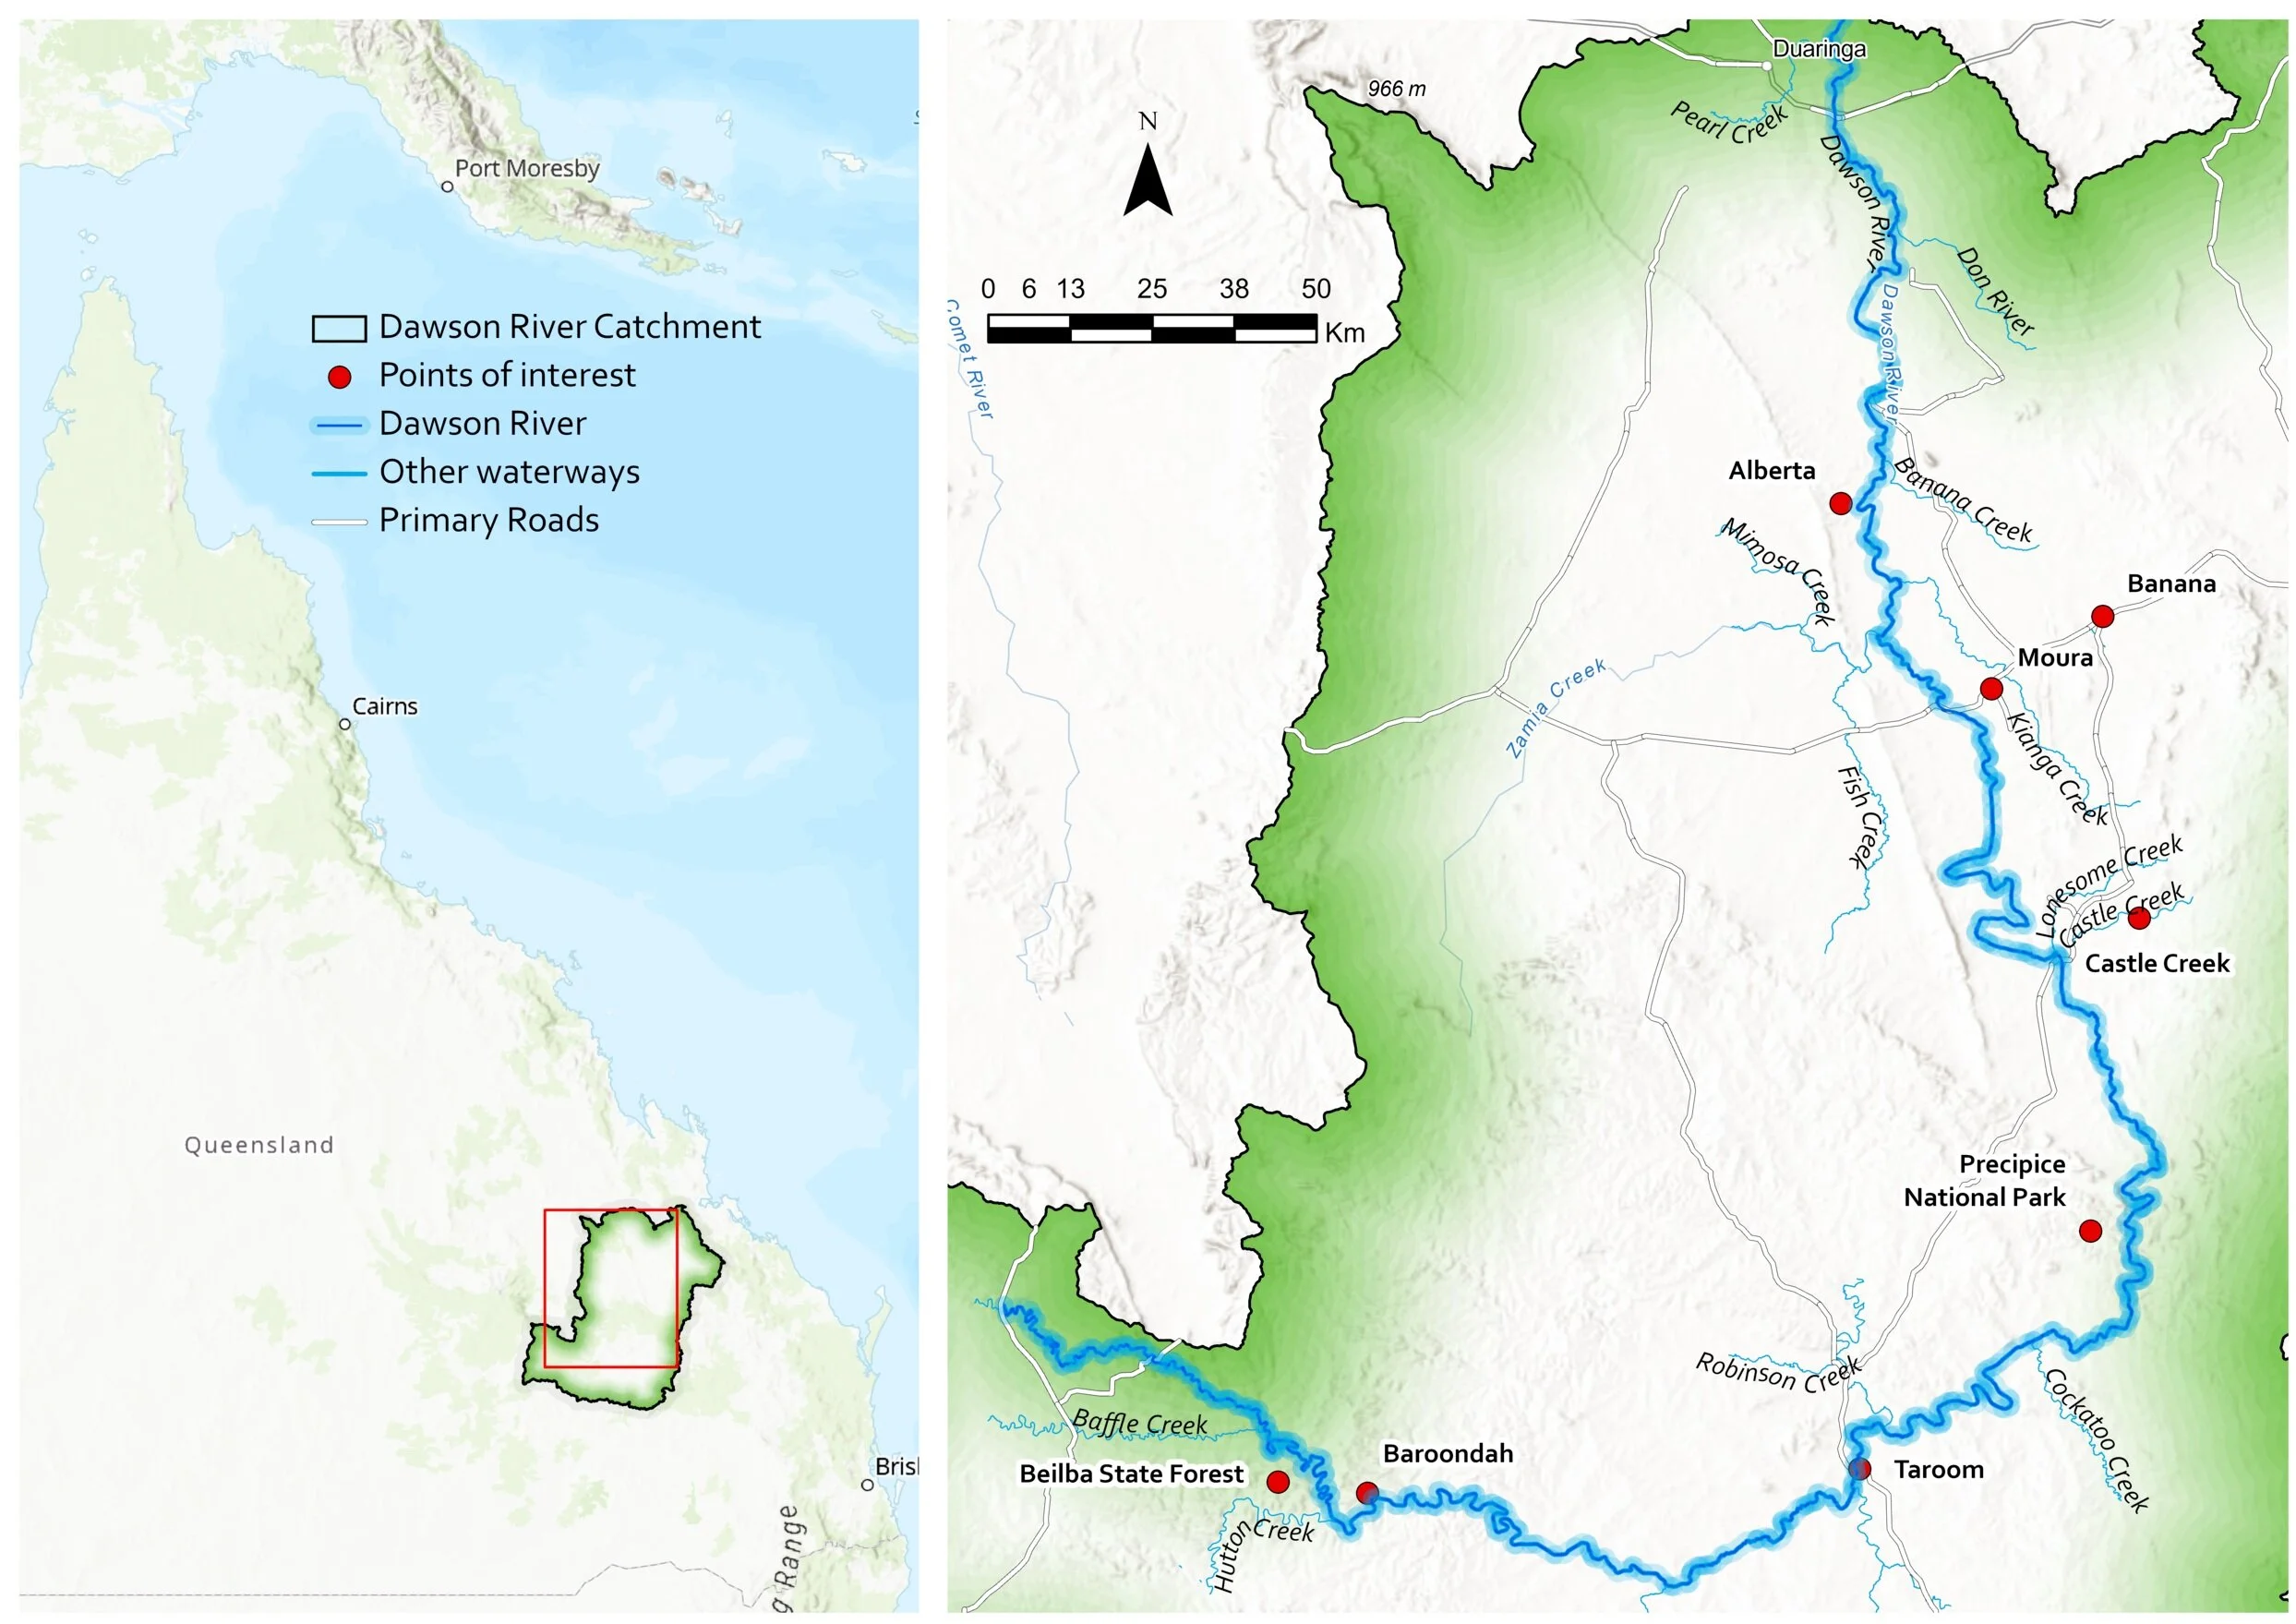
Dawson River — Study Area Map
Produced to support the Wildlife Preservation Society in depicting a study area for a conservation research project along the Dawson River.
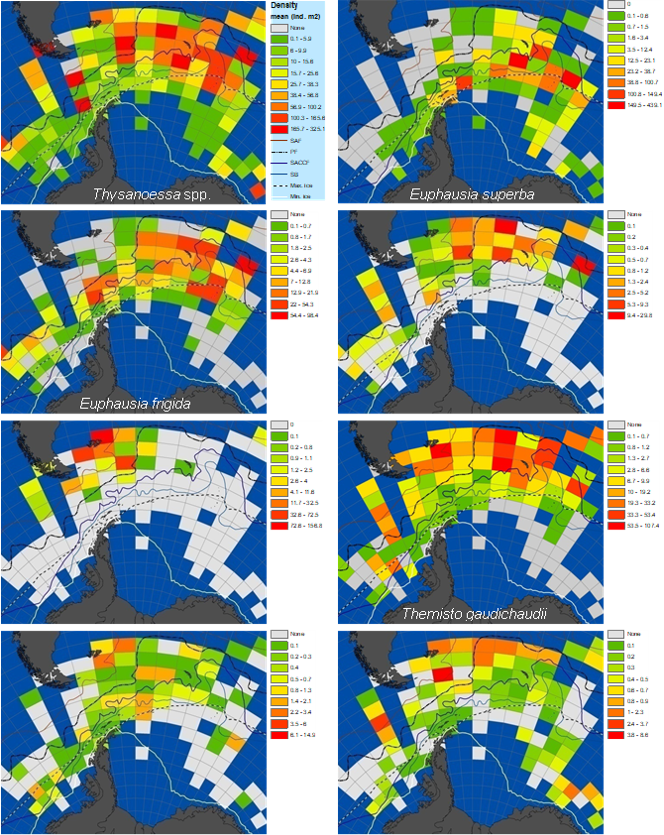
Macrozooplankton Distribution — South-West Atlantic, Southern Ocean
Horizontal distribution of major macrozooplankton species in the south-west Atlantic sector of the Southern Ocean. Data are means of results from stations lying within each 2° × 5° grid cell. Produced during research at the British Antarctic Survey.
Vintage Style Atlas Map
A vintage-themed atlas map developed for illustration purposes — produced by overlaying multiple layers with experimental symbology to achieve a classic cartographic aesthetic.