12 07 03 N
N
27.4705° S  153.0260° E

Every site constraint, in one place — for faster, defensible decisions

SiteCensus

450+ live spatial layers, queried for everything that touches your site — the desktop research that normally takes hours or days, done in as little as 5 minutes. Then map, measure and track change over decades, all without leaving the workspace.

🦘 Every subscription funds wildlife conservation — $5 per month to Wildlife Queensland & AWC

Get started for free
Map. Assess. Report.

Built on geospatial science trusted by

State Government Agencies· Infrastructure & Energy· Water Utilities

450+ data layers 6 categories <5 min replaces hours of manual research QLD live now 7 more states coming
What it does

Everything you need to understand a site, in one run

450+ live spatial layers — ecology, abiotic conditions, hazards, tenure and planning — every feature that touches your study area, pulled together in a single run. Here's what you walk away with.

The full site picture, in one place

450+ layers of ecology, hazards, tenure and planning constraints, queried against your study area in one run.

Consultant-ready reports

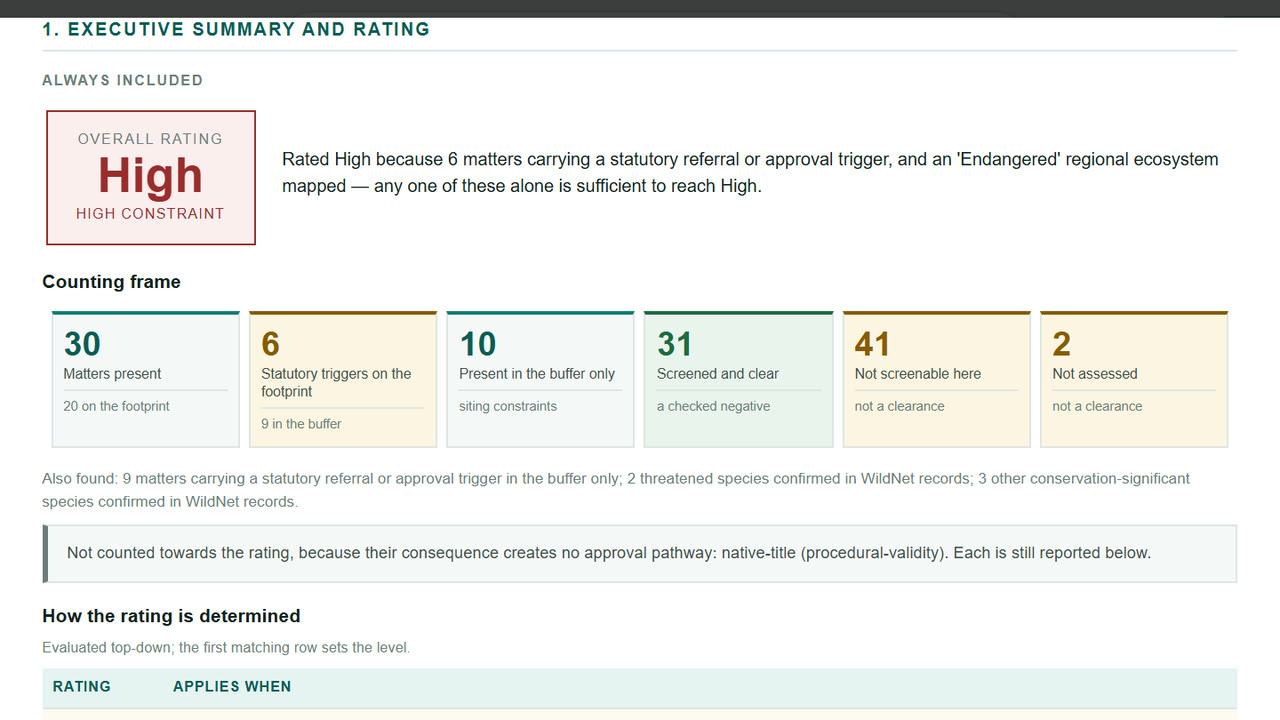
A branded PDF or Word report, full or tailored to your project — ready to drop into an assessment or DA.

Projects you can save and reopen

Every study area and result set is kept in your account, ready to revisit or update whenever you need it.

Results in your formats

PDF, Word, CSV and GeoJSON — plug the output straight into your own workflow.

More than a data lookup

A full assessment workspace, not just a data feed

Pulling the layers together is only the start. SiteCensus gives you the tools to interrogate a site, see how it's changed, and turn the result into a defensible deliverable — all without leaving the map.

🎯

One-run spatial query

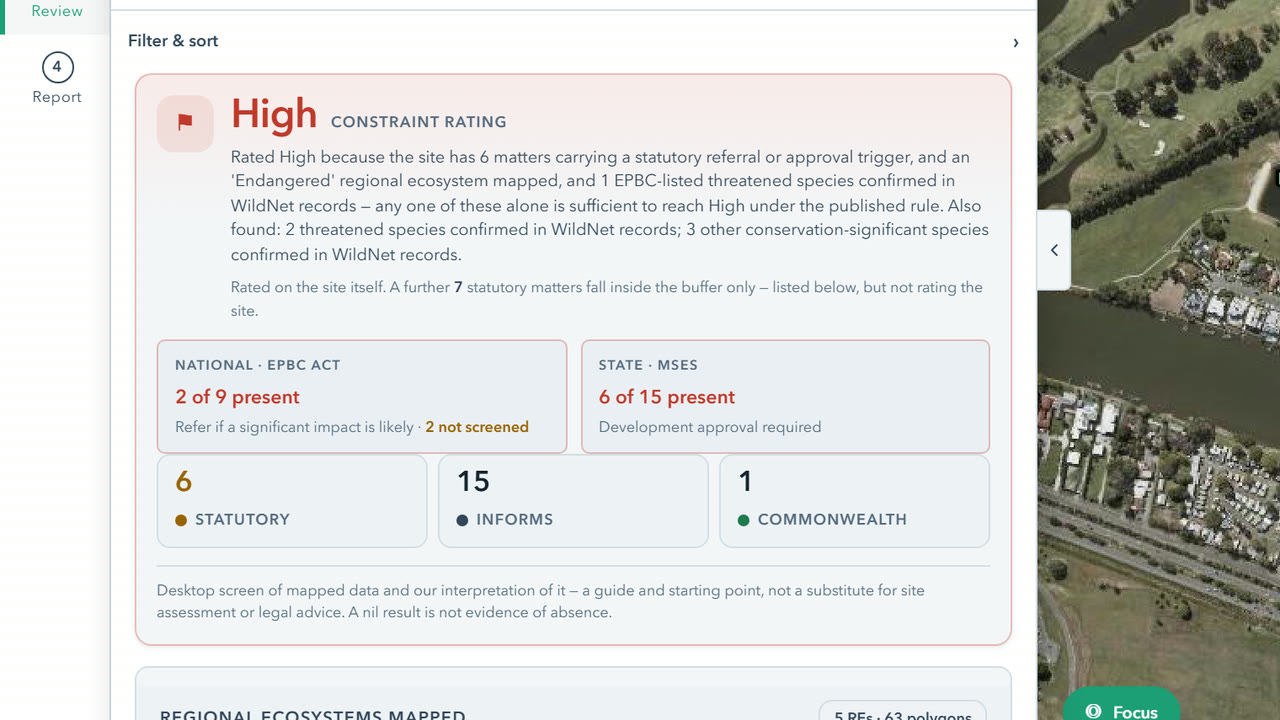
Query every active layer against your study area in a single click. Results group by category with area and % of site covered, statutory triggers flagged, and an option to catch significant features just outside your boundary too.

📐

Interactive map & measurement tools

Measure distance and area, read off coordinates, run quick buffer and setback checks, mask outside the site, swipe to compare layers and pull an elevation profile — a working map, not a static export.

🛰

Land cover & imagery over time

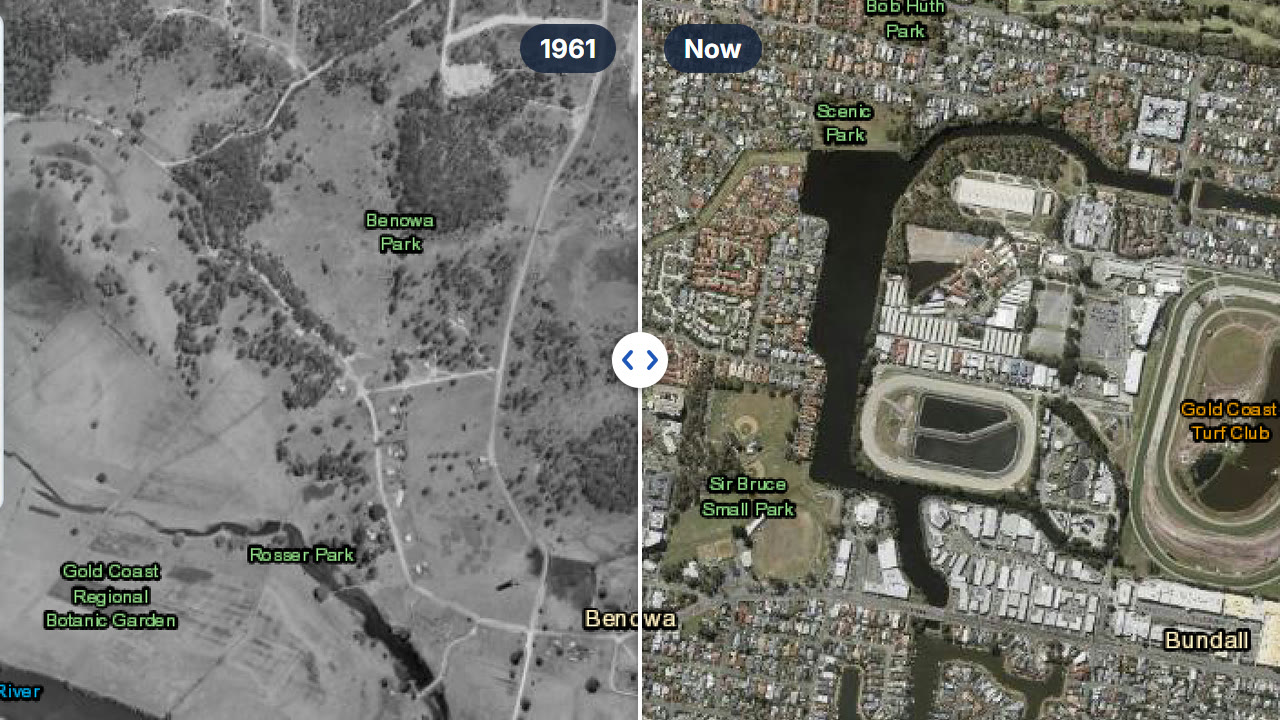
Step through satellite imagery, NDVI and land-cover change from 1988 to today — the evidence base for clearing history and remnant-versus-regrowth calls, right alongside the constraint query.

🦉

Species records, built in

WildNet and Atlas of Living Australia records are queried automatically, conservation-significant species are flagged in your results, and you can plot GBIF citizen-science records straight onto the map.

🗺

Branded, print-ready map outputs

A built-in print composer turns any map view into a professional, personalised figure — your logo and branding, plus legend, scale bar, north arrow and locality inset.

🔗

Straight to the source

One click into the authoritative portals for the checks a map can't fully replicate — EPBC Protected Matters (with your study-area centroid auto-copied), Native Title Vision, ACHRIS, the ALA and Queensland Globe.

Who it's for

Built for anyone who needs to know what's on a site

SiteCensus started as a tool for ecologists — but the same live constraint picture is just as useful to the people who plan, design, approve or review the work happening around it.

🦎

Ecologists & Environmental Scientists

Pull the full desktop constraint picture in minutes, for every new site.

🏛

Planners & Approval Officers

Independently check what's actually on a site a consultant is writing about — without waiting on someone else to walk you through it.

🏗

Engineers & Infrastructure Teams

Scope ecological, abiotic and planning constraints early, before a route or site design locks in a costly rework later.

🏢

Government & Agencies

A consistent, defensible constraint picture across every project you assess, sourced straight from the same live agency data.

SiteCensus

Six constraint categories — 450+ layers

Everything queried in a single run, organised for a fast, defensible read.

🌿
Remnant Ecosystems & Vegetation
Regional ecosystems · RE mapping and biodiversity status · Vegetation management categories · Regulated vegetation · Essential habitat
🦎
Fauna & Biodiversity
WildNet species records · Atlas of Living Australia (ALA) reference records · EPBC listed species and communities · Koala habitat (SEQ) · Marine and migratory species
Physical / Abiotic
Soils and land resource · Geology · Groundwater dependent ecosystems · Flood hazard (FloodCheck) · Bushfire and coastal hazard · Acid sulfate soils
🗺
Habitat & Priority Areas
MSES areas · Environmentally sensitive areas (Cat A & B) · Wetlands · GDE networks · Biodiversity corridors · Aquatic conservation
🛡
Protected Areas & Tenure
National parks · Nature refuges · CAPAD · Native title · Marine parks · World & National Heritage · Ramsar wetlands
🛰
Background / Context
Satellite imagery & land cover change (1988–2025) · Elevation, hillshade & terrain profile · Locality, cadastre & tenure reference
1

Define your study area

Draw a polygon, upload a shapefile or GeoJSON, or search by lot/plan. Apply a buffer to capture nearby constraints.

2

Explore the data

Toggle layers on and off by category. Click any feature for attribute details, data currency and source agency.

3

Run your assessment

Spatially query all active layers in one click. Results group by category with a full feature register, area and % cover, statutory triggers flagged and conservation-significant species listed.

4

Generate your report

Compose a branded, print-ready map figure, then export a PDF or Word report with layer register and methodology — Full, or Tailored via a short project-intake questionnaire.

Get started

Everything you need, ready today

SiteCensus is a mature, actively-used platform for the professionals who scope, assess, plan and approve projects across Queensland. Every account starts with a 7-day free trial (card required) — cancel anytime before you're charged.

🔓

Full access, 7-day trial

All features unlocked from day one. Run real projects, generate real reports. Card required to start, cancel anytime before the trial ends and you won't be charged.

💬

We'd love your feedback

Tell us what worked, what didn't, and what's missing — the product keeps improving with input from the professionals who rely on it.

🌿

Profit for purpose from day one

BioGeo is a profit-for-purpose business. $5 from every paid subscription goes to the Australian Wildlife Conservancy and Wildlife Queensland.

🎁 Start your free trial

Takes 2 minutes. Paying by purchase order? Email us instead.

Coverage

Built for the whole of Australia, one state at a time

SiteCensus is being built state by state, tailored to each state's legislation, environmental and planning datasets and agencies. Queensland is live now — the same architecture is rolling out to the rest of the country over the coming months.

QLDQueensland● Live
NSWNew South WalesComing soon
VICVictoriaComing soon
WAWestern AustraliaComing soon
SASouth AustraliaComing soon
TASTasmaniaComing soon
NTNorthern TerritoryComing soon
ACTACTComing soon

Your subscription automatically includes access to every new state version as it goes live. Subscribe now on Queensland and you'll have national coverage as it rolls out — no upgrade, no extra cost.

Pricing

Simple, transparent pricing

Pricing is shown below so you know exactly what you're signing up for. All prices in AUD, GST added at checkout.

Questions before you commit? Happy to answer anything about the app, the data or how it fits your workflow.

Email info@biogeo.com.au →
SiteCensus QLD live Founding rate · 20% off

For ecologists, environmental scientists, planners, engineers and consultancies working on Queensland projects.

Founding rate — 20% off while we're launching Subscribe before 30 September 2026, or before our second state goes live — whichever comes first — and your rate stays fixed for as long as you're subscribed. Prices rise as each new state launches.
🎁
Start with a 7-day free trialCard required to start. Cancel anytime before your trial ends.
Screen Free — sign up, no credit card. A quick, limited site check for non-specialists.
Coming soon
Free
Notify me →
Teamadd or remove users anytime — no seat cliffs
5 users
$397$318per month
$3,180/yr — 2 months free
~$64/user
Included
450+ live spatial layers
All 6 constraint categories
Lot/plan, address and coordinate search
Draw boundary, upload GeoJSON / KML / SHP
Buffer analysis
Full or Tailored reports, via project intake
Branded PDF & Word reports
Print composer for branded map figures
CSV & GeoJSON export
Unlimited saved projects
Every new state added free — your rate never rises
🦘 $5 goes to wildlife conservationper subscription per month — AWC and Wildlife Queensland

More than 15 users, paying by purchase order, or a government agency? We'll put together tailored terms.

Contact BioGeo for tailored pricing →

Charity or conservation group? Registered charities, conservation and Landcare groups qualify for discounted pricing.

Get in touch about charity pricing →
FAQ

Common questions

Anything not covered here — email info@biogeo.com.au and we'll get back to you promptly.

I'm not an ecologist — is this still useful for me?
Yes. SiteCensus queries ecological, abiotic and planning-relevant data layers, not just ecology — planners, engineers, government officers and other project stakeholders use it to independently understand or verify what's on a site, without needing to be the one producing the report.
Is this the same data as the Queensland Government's own portals?
Mostly, yes — SiteCensus queries the same authoritative REST endpoints used by agency portals such as QSpatial, QPID and the EPBC Protected Matters Search Tool. It brings the relevant layers together in one place and runs them against your study area automatically, rather than requiring you to visit each portal separately.
Can I see how a site has changed over time?
Yes. The imagery and land-cover tools let you step through satellite imagery, NDVI and land-cover change from 1988 to the present — useful supporting evidence for clearing history and for distinguishing remnant vegetation from regrowth, separate from the constraint query itself.
Is it just a data lookup, or can I actually work on the map?
It's a full working map. Alongside the one-run constraint query you can measure distance and area, run buffer and setback checks, mask outside the study area, swipe to compare layers, read an elevation profile, plot citizen-science species records and build an annotated, report-ready figure — all in the browser.
Can I use the reports in a development application or ecological assessment?
Reports are suitable for use as supporting material in desktop assessments, EIS appendices, flora and fauna assessments and preliminary constraint reports. They are indicative only — results must be verified with the relevant data custodian before being relied upon for statutory decisions.
What happens when my 7-day trial ends?
Your subscription starts automatically at the monthly or annual rate you selected and your card is charged. You will receive a reminder email before the trial ends. If you cancel before day 7 you won't be charged anything.
Can we pay by purchase order or invoice?
Yes. If your organisation requires an invoice or purchase order before setting up an account, email info@biogeo.com.au and we'll arrange it. We issue invoices with net-14 or net-30 payment terms, and activate your account once payment clears. The trial period is waived for invoice customers.
How current is the data?
Every layer is fetched live from the agency REST endpoint at the time you run your assessment — there is no locally cached data. The layer panel shows the data freshness and update cadence for each layer.
Does it work on mobile or tablet?
SiteCensus is designed for desktop use and works best on a laptop or desktop browser. Basic functionality is accessible on a tablet, but the map interface and sidebar are optimised for larger screens.
Can I switch between monthly and annual billing?
Yes. You can switch from monthly to annual at any time from your account settings — the annual rate takes effect at the start of your next billing period.
What states are covered, and when will more be added?
Queensland is live now. Additional states are being built progressively and will roll out over the coming months. Once a second state goes live, an All-States Bundle will be available. Your existing subscription automatically includes each new state at no extra cost.
Can multiple people at my organisation share a subscription?
Solo covers a single user. The Team plan covers 2 to 15 users on a per-seat basis — add or remove members anytime, and the per-user rate drops as you add more, with no fixed bands or wasted seats. For 16+ users, or government and purchase-order arrangements, contact us for tailored pricing. Sharing login credentials is not permitted under the Terms of Service.
Is this connected to BioGeo's other work — will you be competing with us?
No. Outside of SiteCensus, BioGeo's work is geospatial science and ecological modelling only — corridor connectivity, habitat suitability modelling and remote sensing. BioGeo does not offer ecology desktop assessments, DA support or field ecology services, so SiteCensus isn't a funnel into work that competes with your own.
What if I need a feature the app doesn't have yet?
SiteCensus is actively developed. Email info@biogeo.com.au with what you need and it'll be considered for the roadmap — the product has grown substantially based on exactly this kind of feedback.